Chuyển đến nội dung chính

An Ever-Changing Market Street

An Ever-Changing Market Street
By Jeremy Menzies

As we look towards a new future for Market Street under the Better Market Street Project, here's a brief look back in history at Market Street from the 1850s to 1970s.

From muddy cart tracks and plank walkways to wide brick sidewalks, transit lanes and bikeways, Market has been the ever-changing heart of our city since it was established in the mid 1800s.
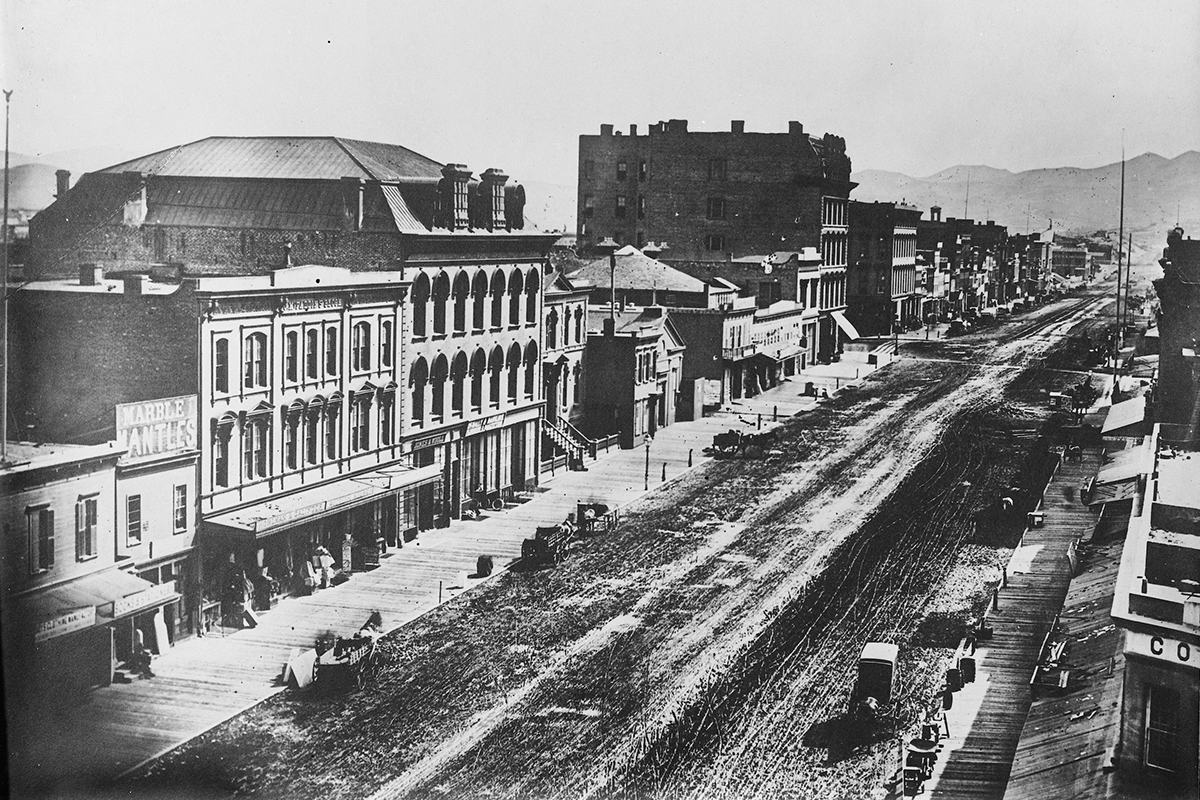
photo of muddy market street circa 1856

First surveyed in 1847 by Jasper O'Farrell, Market Street was laid out in part to provide a transition between the two opposing street grids north and south of Market. Planned as the city's widest street, Market was meant to be San Francisco's main boulevard and quickly became one of the busiest thoroughfares in town. The photo above was taken circa 1856 looking west from 3rd Street, a time when downtown looked more like a small town than a city.
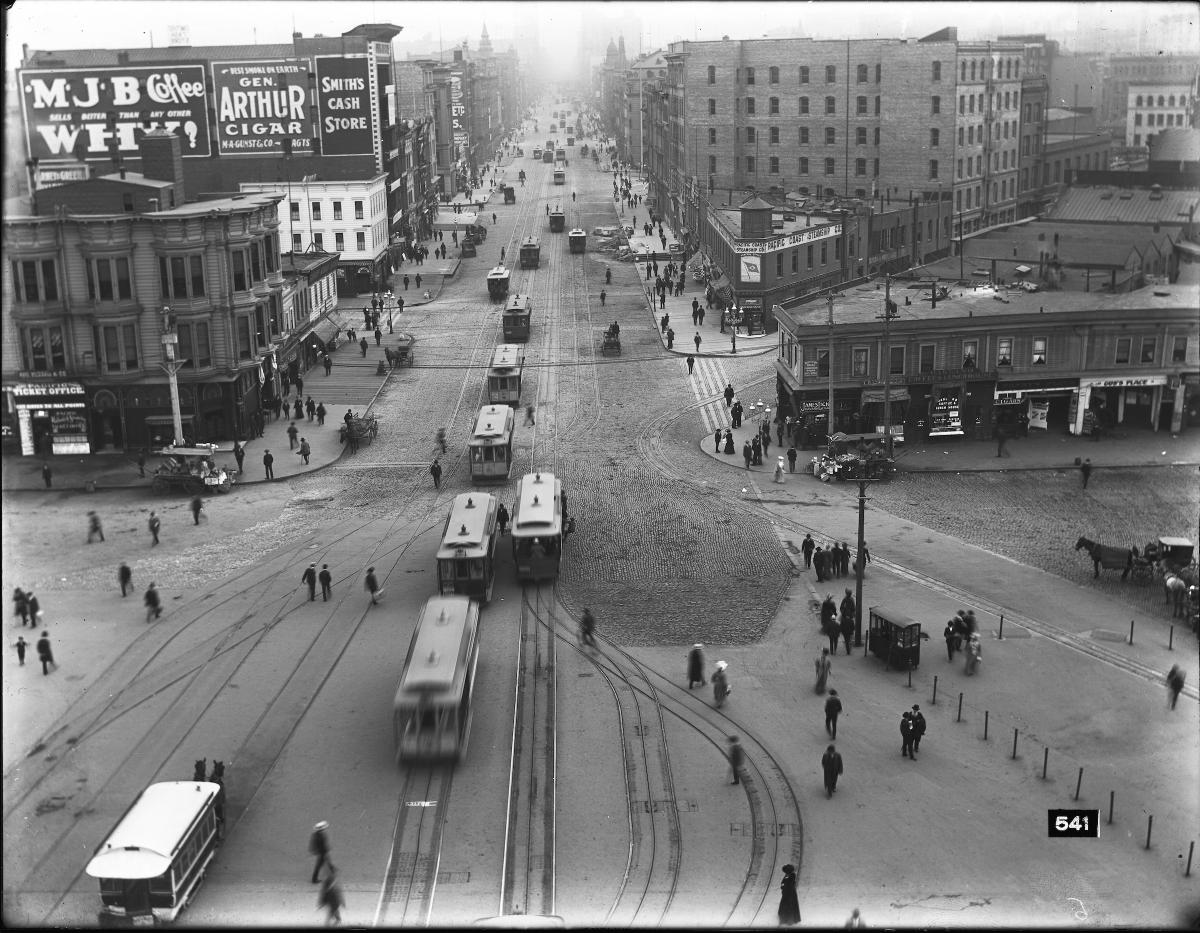
overhead view of cable cars on market street with pedestrians

Long before hybrid diesel buses and e-scooters, Market Street was home to multiple cable car and horse car lines that provided service along the corridor and connections to farther-flung destinations. Soon after their invention in 1873, cable cars grew to dominate public transit in the last decades of the 19th Century. This 1905 view was taken looking west from the Ferry Building during a peak time for cable cars on Market.
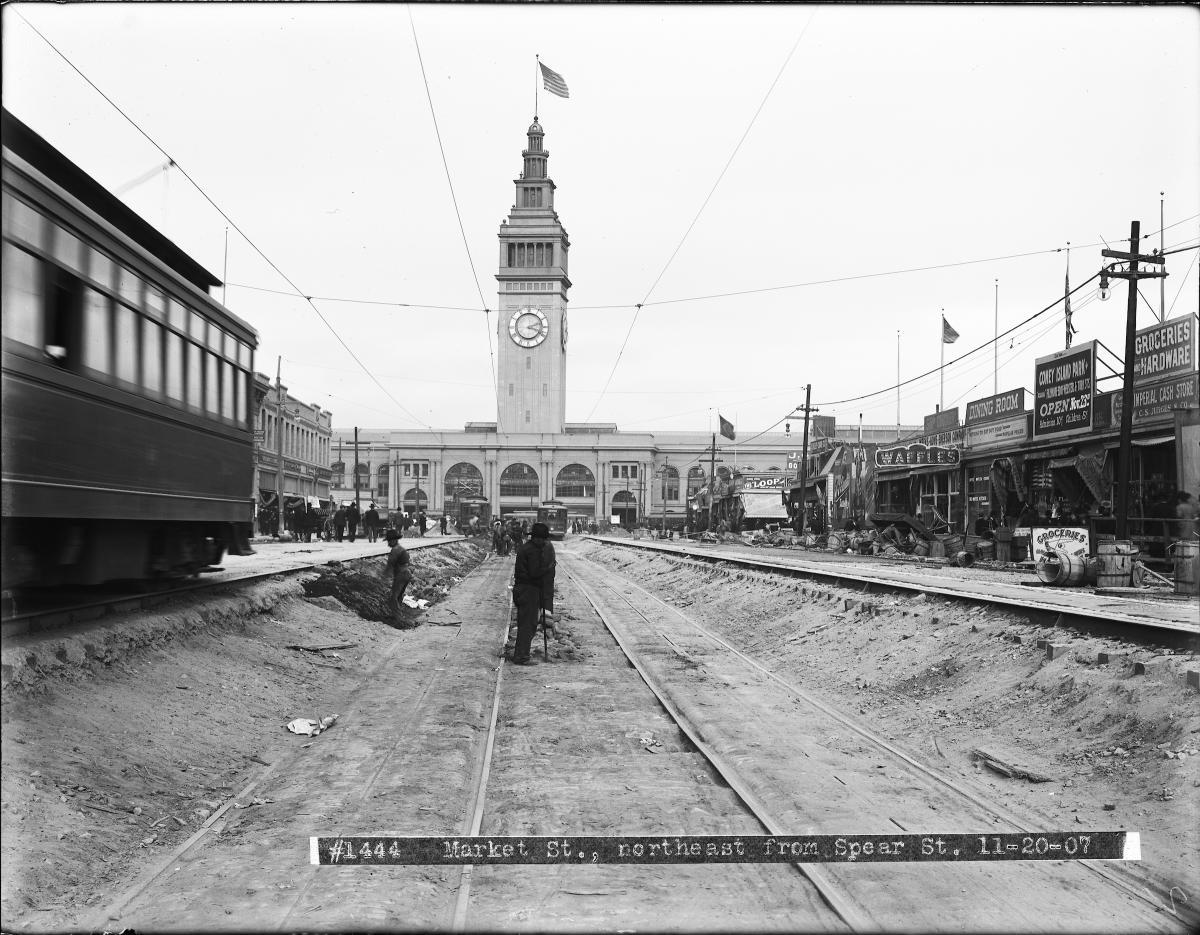
work men standing in sunken road with ferry building in background.

The 1906 Earthquake and Fire completely changed the transit landscape of San Francisco and marked a complete change to Market Street's role in our transportation network. Following the disaster, every cable car line was removed from Market and the street was reconstructed for faster, more efficient electric streetcar operation. This 1907 shot shows workers just west of the Ferry Building working on abandoned cable car tracks that would soon be buried under the pavement to make way for electric streetcars.
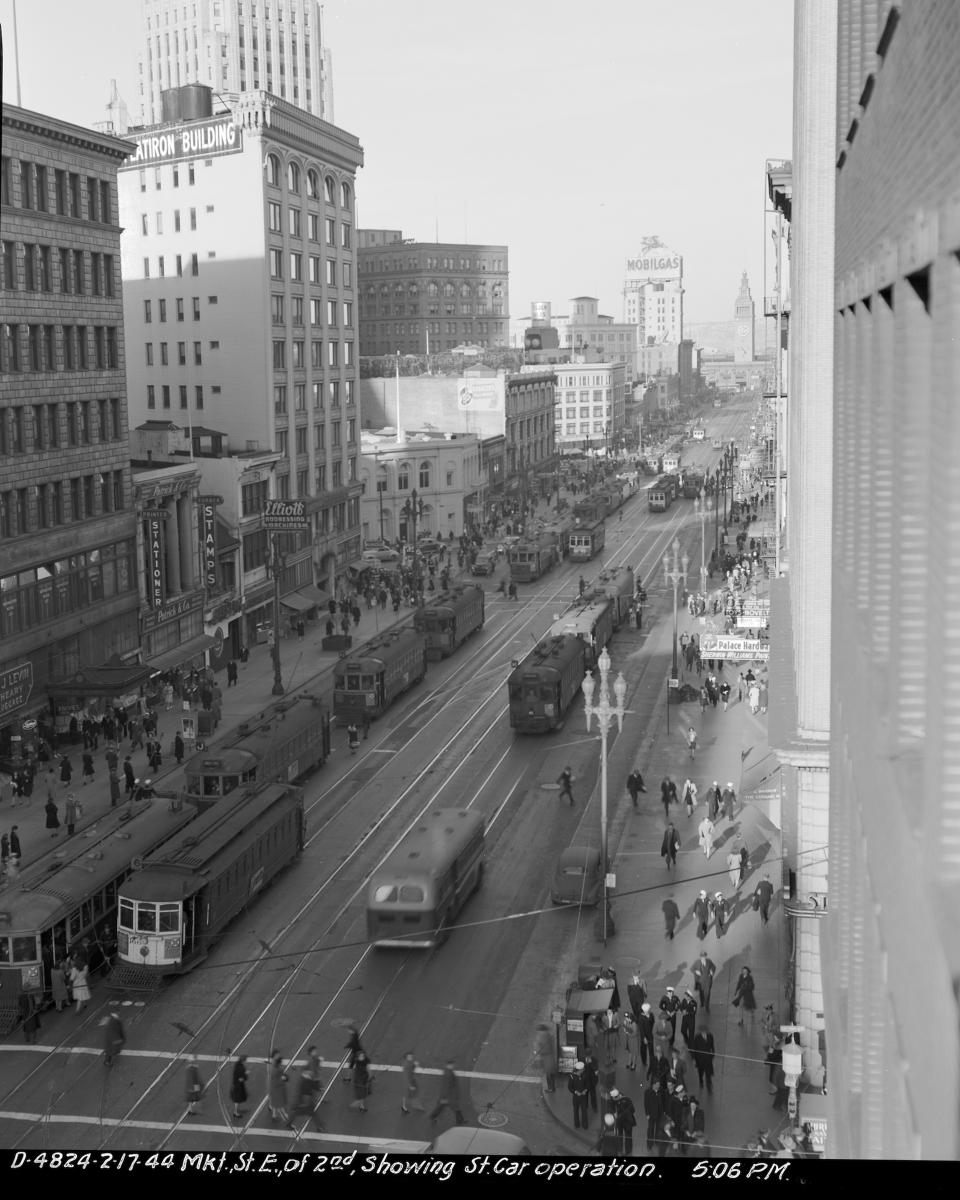
overhead view of streetcar traffic and people walking on market street

During the 1930s and '40s, four tracks of streetcar traffic (two inbound, two outbound) dominated Market Street. Dubbed "the roar of the four" due to the noise created by dozens of hulking streetcars plying the road. Transit was certainly king of the road during this period of high ridership.
traffic and people waiting for streetcars on market street

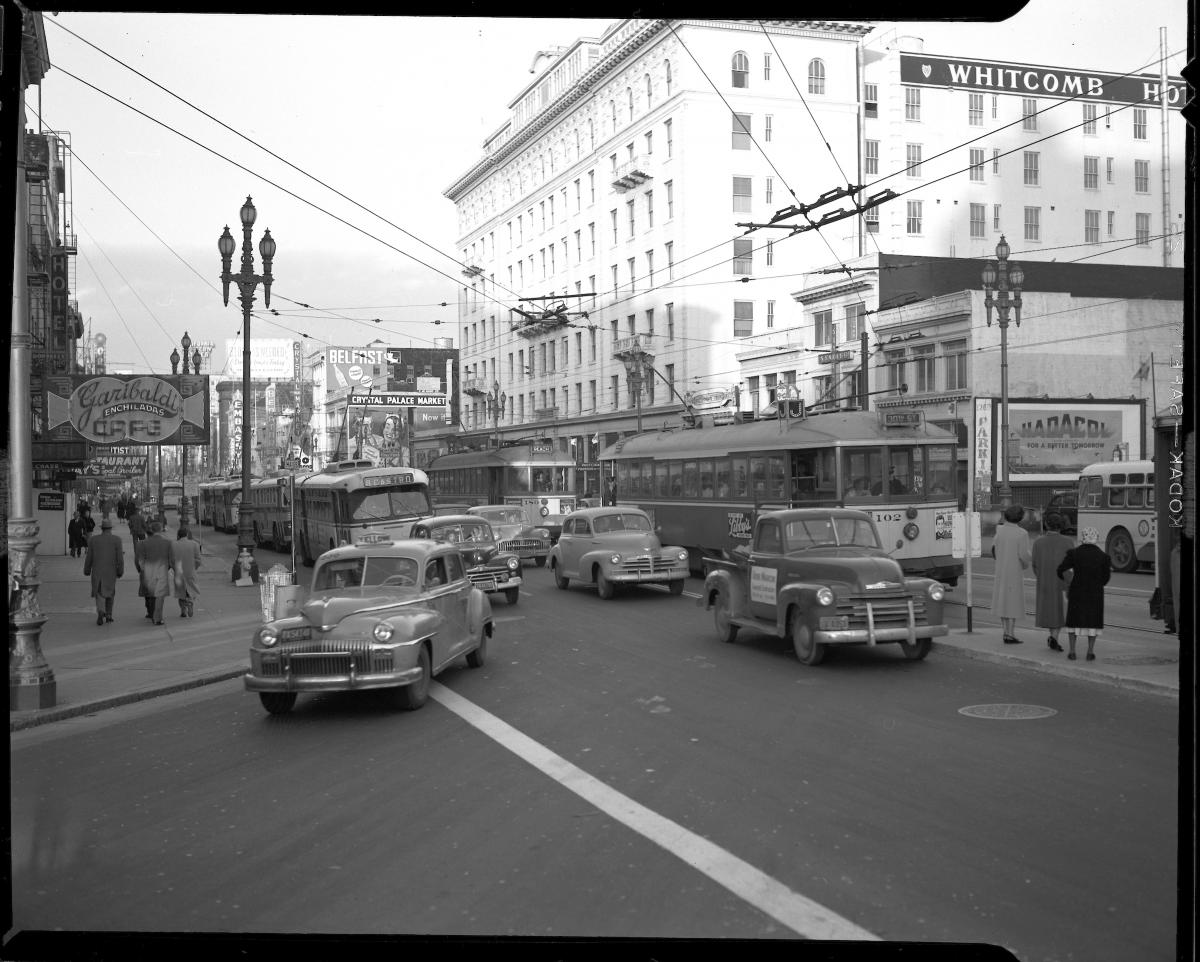
Following World War II, Market Street faced an increased traffic burden as personal car ownership climbed and transit ridership declined. Traffic on Market Street slowed down all travel modes and made for a hazardous pedestrian environment, especially during rush hours. Congestion became enough of a problem that in a 1963 report, City planners analyzed the possibility of moving all auto traffic off of Market and all streetcar traffic into an underground subway to rebuild the street as a pedestrian mall.
overehad view of construction of BART and Muni Metro tunnels on Market street

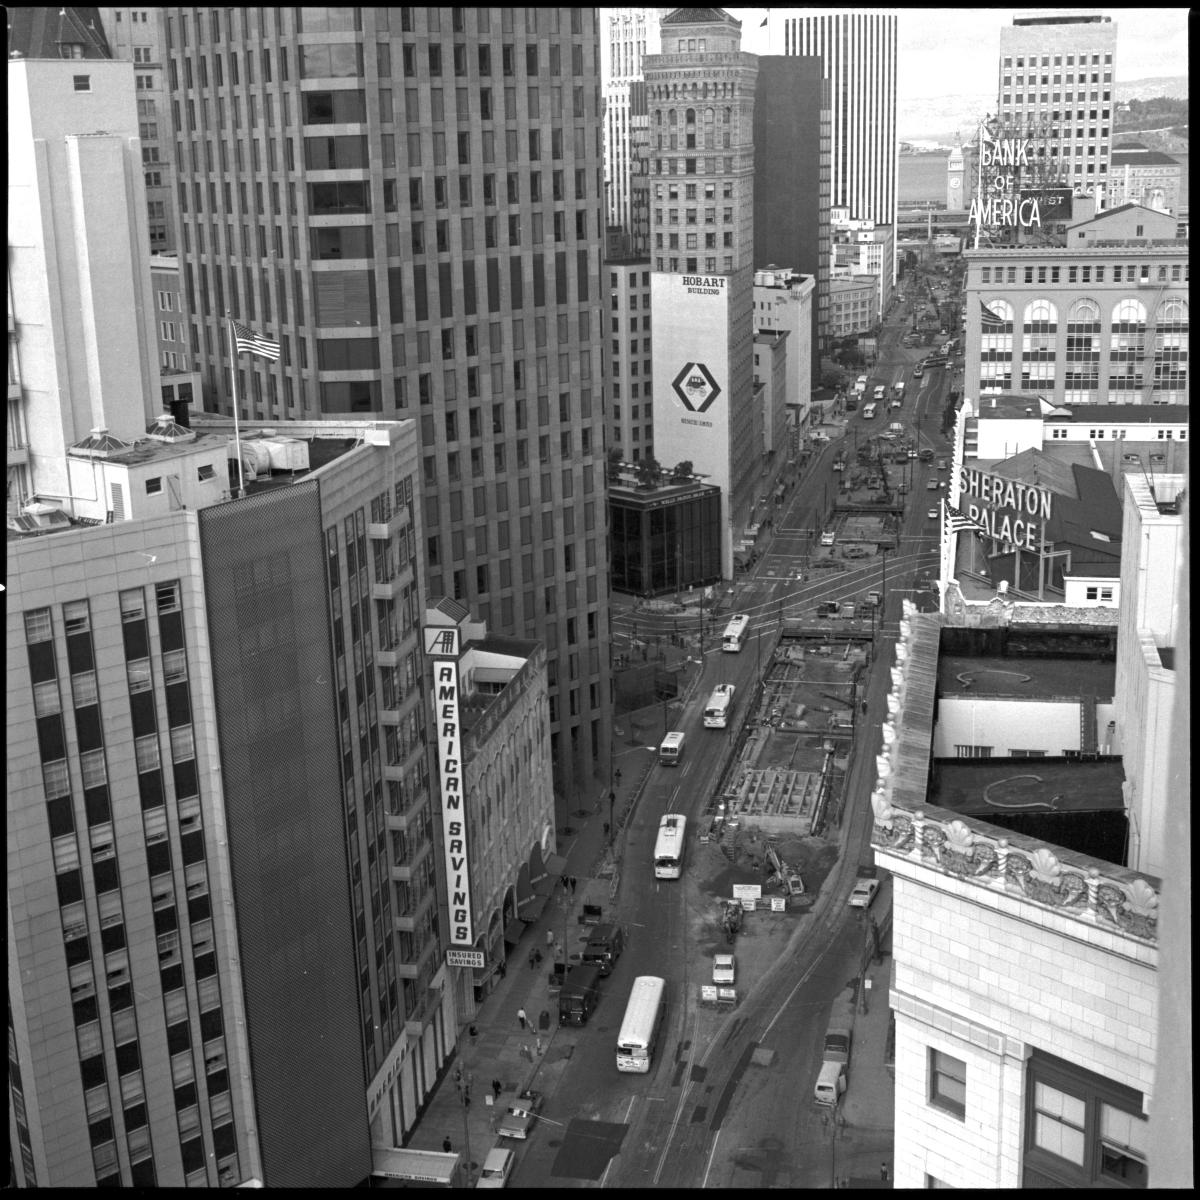
Perhaps the most significant change since 1907 came to Market in the 1960s and 70s with the construction of the Market Street Subway and BART tunnels and stations. Plans and proposals for a Market subway had been floated since at least 1912, but it wasn't until the BART proposal gained enough support to proceed that one version of that dream was realized.

Today, Market is transitioning to yet another incarnation of itself with more room for people walking, riding transit, and biking. Just one more chapter in the history of our city's most storied boulevard. Check out more photos of Market Street through the years on the SFMTA Photo Archive and follow us on Instagram!


Published January 31, 2020 at 05:56AM
https://ift.tt/318Mu2c

Nhận xét

Bài đăng phổ biến từ blog này

Writing samples: Physical activities

Luyện thi IELTS Vietop  gửi bạn bài Writing samples: Physical activities   bên dưới nhé! Các bạn theo dõi và ôn luyện  IELTS Writing  thật tốt nhé! Task 1: The bar chart below shows the percentage of Australian men and women in different age groups who did regular physical activity in 2010. The bar chart depicts the percentages of Australian males and females in various age groups who exercised regularly in 2010. Overall, men’s engagement peaked between the ages of 15 and 24, while women’s participation peaked in the 45 to 54 age group. Besides, in every age group save the youngest, more women than men participated in regular exercise. Women in the youngest age group who regularly exercised were 47.7%. After then, their participation increased significantly with age, peaking at 3% over a half in the 45-54 age group. Above that, it began to deteriorate, with only 47.1% of people in the most senior age group engaging in regular workout. The lowest age ...

Review sách Hackers IELTS Reading

Sách “Hackers IELTS” phù hợp cho bạn đang muốn tự ôn luyện tại nhà nhưng không biết nên chọn sách nào học cho hiệu quả và khoa học. Bộ sách “Hackers IELTS” được các chuyên gia tin tưởng giới thiệu cho những bạn chưa biết gì về IELTS, không biết cấu trúc đề thi IELTS gồm những phần nào,…thì “Hackers IELTS” rất phù hợp với những đối tượng này. Xem thêm bài viết đang được quan tâm nhất: Review sách... Bạn hoàn toàn có thể đạt 6.5 IELTS trở lên là điều không khó nếu như bạn biết cách sắp xếp lộ trình học sao cho logic và thêm việc lựa chọn 1 vài tài liệu thực sự hay và dễ học, thì mọi nút thắt đều được gỡ bỏ. Hàng nghìn độc giả đã mua và nêu cảm nhận rất tốt về bộ sách này chính là minh chứng cho việc “Hackers IELTS” sẽ giúp bạn làm được điều mà bạn mong ước. Review sách Hackers IELTS Reading Nội dung chính BOOK REVIEW “Hackers IELTS” Giới thiệu chung Ưu điểm Bố cục mỗi bài gồm Khuyết điểm Kết luận BOOK REVIEW  “Hackers IELTS” Tên sách: Hackers IELTS Reading Nhà xuất bản: Nhà xuất bản ...

WRITING SAMPLES: EDUCATION

Vậy nên, hôm nay Vietop sẽ gửi đến bạn bài mẫu EDUCATION Task 1,2 về chủ đề này, cùng xem và lưu lại để ôn tập và rèn luyện kỹ năng IELTS Writing nhé! Task 1:  The charts below show the results of a survey of adult education. The first chart shows the reasons why adults decide to study. The pie chart shows how people think the costs of adult education should be shared. The bar chart displays why adults opted to study, while the pie chart depicts people’s thoughts on the tuition fee distribution of the study mentioned before. Overall, the two primary reasons why individuals have maintained their education, according to the poll results, are because they are interested in subjects and to get a degree. It should also be noted that the majority of school expenditures should be covered by individuals themselves, according to the study. It can be shown that the two primary reasons why adults continue their education are because they are interested in the program and to get ...