By Maia Moran
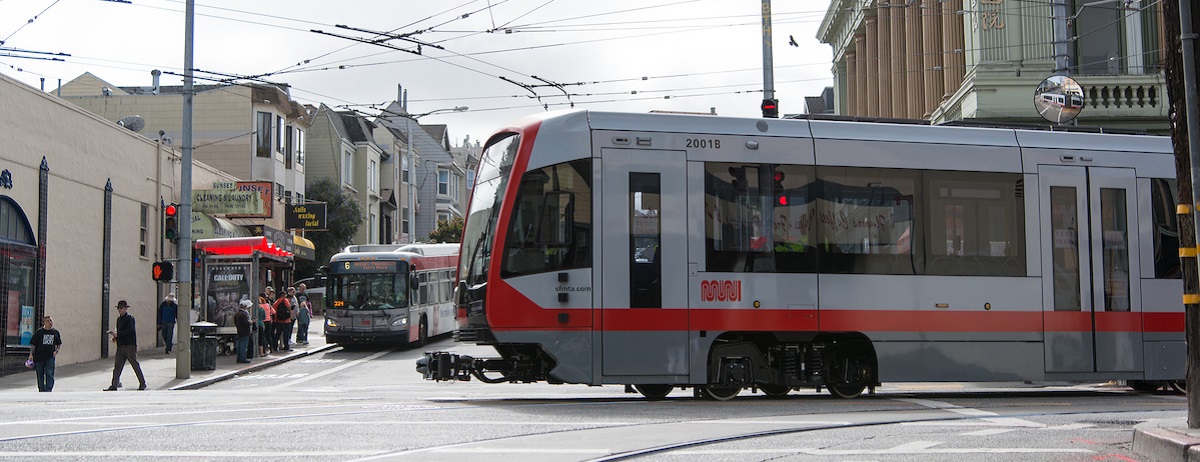
The SFMTA completed its biennial Travel Decision Survey which estimates mode share for travelers whose trips either began, ended, or were within San Francisco. The mode share results from the 2019 Travel Decision Survey and other key data sources were shared at the SFMTA’s annual Board Workshop held on January 28. Sustainable trips are growing where investments are being made in our transportation network. Our Muni Forward Program is a great example of this, which we will explain in more detail. However, based on the overall direction that our mode share is trending, we need to do more to support accessible, long-term sustainable growth. The Travel Decision Survey indicates that the proportion of people choosing cars has increased. Less driving is fundamental to every one of our goals, making performance metrics like mode shift critical.
Mode share is a measure of the percentage of travelers using a particular type of transportation and is an indicator measuring how well San Franciscans can access their daily needs. Mode share is used to track progress towards Strategic Plan Objective 2.2: 80 percent sustainable trips by 2030.
Sustainable modes are defined as modes that support the city’s climate action goals and meet the long-term economic, social, and physical needs of the city. Because they directly support these goals, the SFMTA promotes walking, bicycling, and public transit, as well as those modes that complement their use. As mobility options shift and expand, trip categorizations have changed. In 2019, to align with the Strategic Plan, trips were categorized as sustainable or non-sustainable with the primary shift being TNC trips categorized as non-sustainable. For comparative purposes, all past data has been updated to reflect 2019 categories.
The Travel Decision Survey is a telephone survey conducted by research firm Corey Canapary & Galanis. Interviews of 840+ Bay Area residents took place from May through August 2019, capturing over 10,400 reported trips. The survey was conducted annually from 2012 to 2017 but switched to a biennial survey in 2017 to capture more significant changes in mode shift between survey administrations.
Key Findings
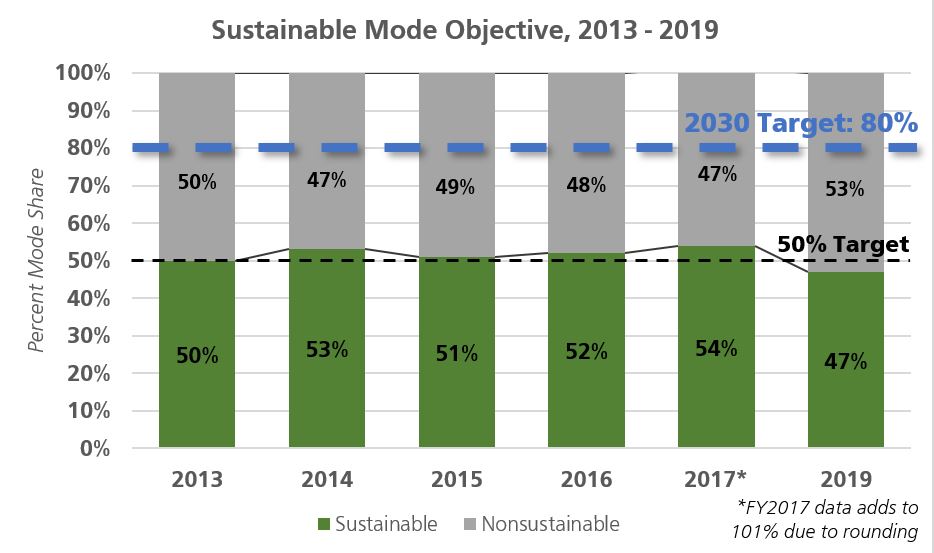
- Sustainable mode share for all trips in 2019 is 47 percent, down from 54 percent sustainable mode share two years ago and below the 80 percent goal by 2030.
- Compared to 2017, walking and transit mode share both decreased while the percent of all non-sustainable mode categories increased.
- The number of raw trips taken in San Francisco has increased over time, based on Travel Decision mode share data and the SF-CHAMP model. From 2017 to 2019, the raw number of sustainable trips decreased, as well as the percent of sustainable trips.
Results
Mode Share & Trip Data
In 2019, sustainable mode share fell to below 50 percent. Between 2017 and 2019, sustainable mode share dropped from 54 percent to 47 percent. Key drops occurred in transit (4 percent decrease) and walking (3 percent decrease) mode share and there were increases across all non-sustainable options including TNC usage, carpooling, and driving alone. Biking has seen incremental increases in mode share but has remained generally steady when rounding for analysis.
Raw trip numbers have also increased, with total daily trips reaching over 4.46 million trips in 2019 representing an increase of 250,000 trips since 2017. When using raw trip numbers, non-sustainable modes increased by over 400,000 trips between 2017 and 2019 while sustainable mode dropped by 155,000 trips, indicating we are gaining non-sustainable trips more than we are losing sustainable ones. Total daily trip estimates are calculated using SFCTA’s latest SF-CHAMP model.
Income & Mode Choices
In addition to trip purpose and mode, the survey collected basic demographic data including age, income, race, and gender. Respondents were given the option to decline to respond to demographic questions so demographic analysis does not represent a complete picture of the survey pool.
For surveying purposes and population representation, responses from within San Francisco were recorded by zip code and aggregated into five geographic zones based on proximity to downtown, travel behavior, and geography.
An analysis of responses by zone and income indicate that in general within San Francisco:
- Lower-income brackets used sustainable forms of transportation with more frequency than higher-income brackets,
- Geographic regions, particularly in the southern part of the city, with less access to higher densities of transportation options observed higher rates of non-sustainable mode share.
In the Bay Area at-large, sustainable mode use was higher at middle- and upper-income brackets.
| $35,000 or less |
$35,001 - $75,000 |
$75,001 - $100,000 |
$100,001 - $200,000 |
Over $200,000 |
Total | |
| San Francisco | 59% | 51% | 46% | 43% | 44% | 47% |
| Outside San Francisco | 43% | 51% | 61% | 48% | 54% | 51% |
| East Bay | 50% | 48% | 68% | 61% | 68% | 60% |
| North Bay | 15% | 79% | 49% | 41% | 44% | 44% |
| South Bay | 39% | 55% | 22% | 29% | 39% | 38% |
Network Improvements
Though transit mode share dropped between 2017 and 2019, a closer look at ridership changes within transit reveals a more encouraging story.
Over the past year, transit ridership has decreased nationally by 2 percent and regionally by 1 percent. While Muni ridership overall has decreased, Muni ridership has fared better and dropped with smaller margins than regional and national shifts.
Ridership has grown significantly where investments have been made in the transit system. Muni Rapid lines have seen significant positive growth as service improvements have been implemented and transit prioritization programs have expanded.
Mobility Report 2019
The 2018 Mobility Report is available here. For more information, please visit: Travel Decision Survey 2019
Published January 29, 2020 at 03:06AM
https://ift.tt/2Gsdy35
Nhận xét
Đăng nhận xét