By Mariana Maguire
The SFMTA’s Equity Toolkit helps us improve Muni service for San Francisco’s most transit-dependent residents and essential workers. Using data layered with mapping we are able to improve access to jobs and key destinations by identifying and fixing gaps in service. Our Equity Toolkit helps us serve San Franciscans better.
The toolkit focuses on San Francisco’s nine neighborhoods identified by the Muni Service Equity Strategy, including the Inner Mission, Outer Mission/Excelsior, Visitacion Valley, Bayview/Hunters Point, Oceanview-Ingleside, Chinatown, Tenderloin, Western Addition and Treasure Island. It’s part of SFMTA’s Transportation Recovery Plan for rebuilding our transportation system for a strong, lasting recovery that is more just and equitable for historically marginalized communities.
For many of our essential workers, COVID-19 is not only a health crisis, it is an economic crisis too. Economic and public health data show that most of our essential workers live in historically underserved equity strategy neighborhoods. If they are dependent on public transportation and can’t get to work reliably, not only does the city suffer, those workers could lose their jobs. That’s why improving job access for our essential workers is so important.
The Equity Toolkit uses transit service data from the six regional transit agencies – SFMTA, BART, SamTrans, AC Transit, Golden Gate Transit and Caltrain. The data includes routes, schedules and frequencies. This show us how far a customer can get within 30, 45 and 60 minutes from key neighborhood locations within neighborhoods identified by the Muni Service Equity Strategy. We can compare job access for transit riders before and during the pandemic, and gauge how our service changes affect access. We can also now detect gaps that we couldn’t before and make better decisions for future Muni service.
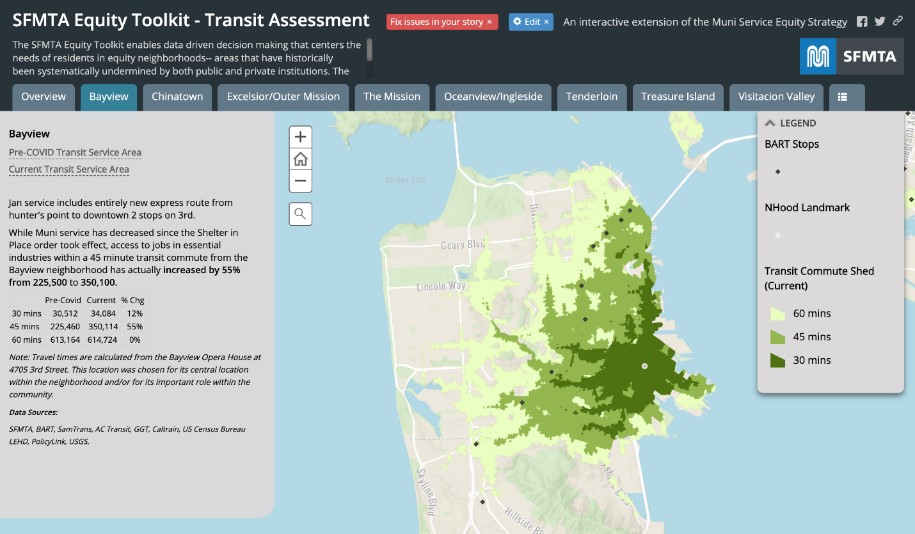
Image from SFMTA’s Equity Toolkit showing information for the Bayview neighborhood post-Shelter-in-Place.
So far, the Toolkit shows that access to jobs and services via public transportation is down in nearly every neighborhood in the city since we started the Muni Core Service Plan in March. That plan prioritized service for high-ridership Muni routes, transportation-dependent populations and connections to essential jobs and services. As a result, people living in neighborhoods identified by the Muni Service Equity Strategy currently have more Muni service than people in other neighborhoods, who generally have more alternatives to public transit.
For example, in the Bayview, where there is a high concentration of essential workers, the existing Core Service Plan has made essential jobs within a 30-minute commute 12% more accessible than before the COVID-19 pandemic. Jobs within a 45-minute commute are 55% more accessible. The Equity Toolkit shows that we still have work to do to ensure adequate Muni service for those who need it most right now. We will continue to use what we learn to improve our Core Service Plan and increase access to essential jobs and services for San Francisco’s most vulnerable communities.
In the coming weeks we will have more blog articles that dive deeper into the neighborhood-specific findings from the Equity Toolkit.
Published December 24, 2020 at 01:52AM
https://ift.tt/3hqhTFL
Nhận xét
Đăng nhận xét