Chuyển đến nội dung chính

Speed and Turn Limits to Boost Safety on Tenderloin Streets

Speed and Turn Limits to Boost Safety on Tenderloin Streets
By Benjamin Barnett

The SFMTA is undertaking two new traffic safety improvements as a part of our Tenderloin Traffic Safety project: (1) prohibiting vehicle turns on red at approximately 54 intersections and (2) reducing vehicle speed limits to 20 miles per hour on 17 corridors.
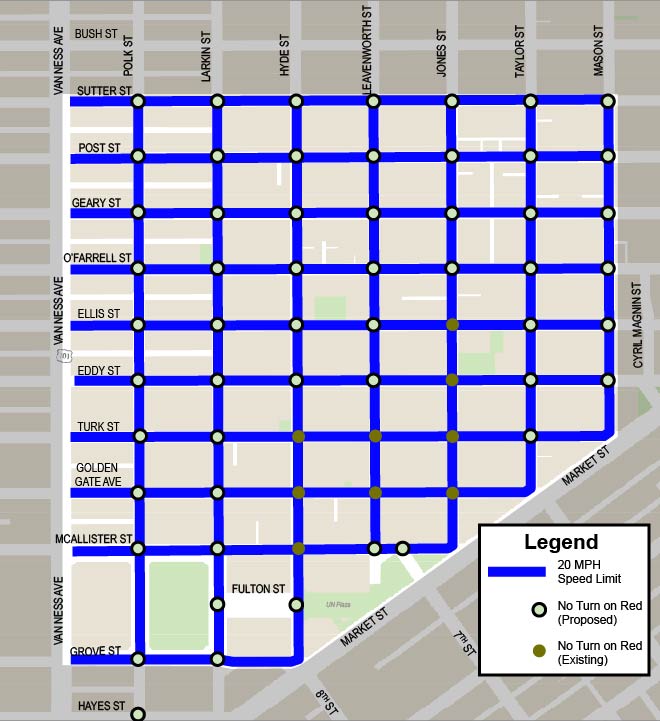
Map showing speed limit reduction to 20mph neighborhood-wide between: Grove Street (south), Sutter Street (north), Mason Street (east), and Van Ness (West). Showing no turn on red regulations neighborhood-wide inclusive of Grove Street (south), Sutter Street (north), Mason Street (east), and Polk Street (west)

(Accessible Engineering details)

Map identifying all Tenderloin corridors and intersections where 20 mph speed limits and No Turn on Red will be implemented.

The Tenderloin is home to many of our most vulnerable communities including historically marginalized groups such as people with disabilities, communities with limited-English proficiency and those living in single-room occupancy hotels (SROs) and supportive housing. At the same time, every single street in the Tenderloin is a part of the city’s High Injury Network -- the 13 percent of San Francisco streets that account for 75 percent of severe traffic injury collision and fatalities. The gravity of the situation in the Tenderloin means we cannot delay taking actions that will improve safety for everyone in this critical neighborhood.

No Turn On Red
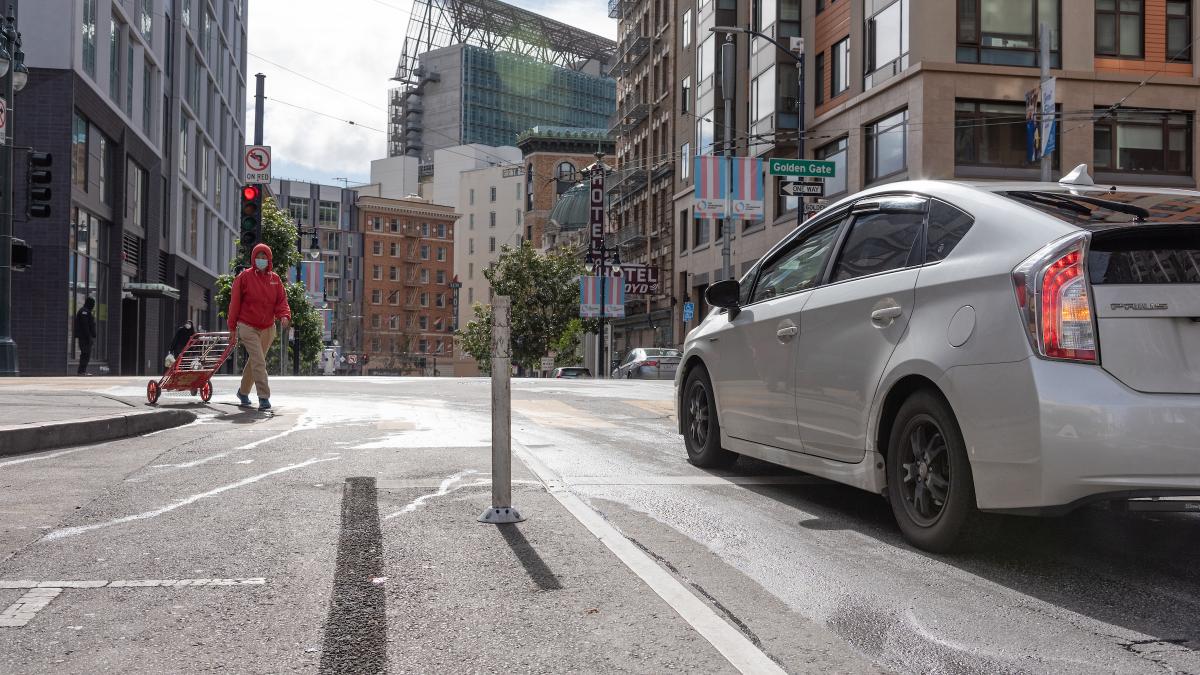
Photo of no turn on red sign at intersection of Golden Gate and Jones

Prohibiting turns while facing a red traffic signal is a proven method for reducing intersection conflicts. This includes both right turns and legal left turns from one one-way street to another. We will be piloting this new program at approximately 54 intersections in the Tenderloin. The program doesn’t include intersections that already have an existing turn prohibition, pedestrian scramble or are not signalized.

Turning on red may be the norm in many driving situations, but should not be on bustling Tenderloin streets. In a study conducted by Department of Public Health and SFMTA of crashes at signalized intersections, turns on red accounted for nearly 20% of turn-related crashes. These were largely clustered in the Tenderloin.

Heavy vehicular traffic in the Tenderloin provides little opportunity for drivers to safely make the turn on red, which leads to vehicles blocking crosswalks while drivers look left trying to find a gap in oncoming traffic. Drivers quickly executing their turn may fail to see a pedestrian legally crossing from the right which can result in an injury collision.

The legislative process for the No Turn on Red program will start in early 2021, with an expected Spring 2021 rollout. No Turn on Red signs will be posted on signal mast arms and poles notifying motorists of the prohibition.

20 mph Speed Limits

Another innovative approach we are taking to make the Tenderloin a safer place for pedestrians is lowering the speed limit from 25 mph to 20 mph. We will put this limit into effect on every corridor in the neighborhood. Vehicle speed is the number one predictor of crash severity. A pedestrian struck at 20 mph versus 25 mph has double the chance of survival. Lowering speed limits to better reflect conditions in the Tenderloin will provide tangible safety benefits in advance of any future engineering changes that can be made. For example, a recent study from Seattle, Washington demonstrated that posting new, lower limits led to reductions in speeds and collisions, even in the absence of streetscape or enforcement changes.

Learn More

For more details, please visit our project page, where you can also read about the community partners who were vital in planning these improvements.


Published February 10, 2021 at 11:44PM
https://ift.tt/3qleMlK

Nhận xét

Bài đăng phổ biến từ blog này

Writing samples: Physical activities

Luyện thi IELTS Vietop  gửi bạn bài Writing samples: Physical activities   bên dưới nhé! Các bạn theo dõi và ôn luyện  IELTS Writing  thật tốt nhé! Task 1: The bar chart below shows the percentage of Australian men and women in different age groups who did regular physical activity in 2010. The bar chart depicts the percentages of Australian males and females in various age groups who exercised regularly in 2010. Overall, men’s engagement peaked between the ages of 15 and 24, while women’s participation peaked in the 45 to 54 age group. Besides, in every age group save the youngest, more women than men participated in regular exercise. Women in the youngest age group who regularly exercised were 47.7%. After then, their participation increased significantly with age, peaking at 3% over a half in the 45-54 age group. Above that, it began to deteriorate, with only 47.1% of people in the most senior age group engaging in regular workout. The lowest age ...

Review sách Hackers IELTS Reading

Sách “Hackers IELTS” phù hợp cho bạn đang muốn tự ôn luyện tại nhà nhưng không biết nên chọn sách nào học cho hiệu quả và khoa học. Bộ sách “Hackers IELTS” được các chuyên gia tin tưởng giới thiệu cho những bạn chưa biết gì về IELTS, không biết cấu trúc đề thi IELTS gồm những phần nào,…thì “Hackers IELTS” rất phù hợp với những đối tượng này. Xem thêm bài viết đang được quan tâm nhất: Review sách... Bạn hoàn toàn có thể đạt 6.5 IELTS trở lên là điều không khó nếu như bạn biết cách sắp xếp lộ trình học sao cho logic và thêm việc lựa chọn 1 vài tài liệu thực sự hay và dễ học, thì mọi nút thắt đều được gỡ bỏ. Hàng nghìn độc giả đã mua và nêu cảm nhận rất tốt về bộ sách này chính là minh chứng cho việc “Hackers IELTS” sẽ giúp bạn làm được điều mà bạn mong ước. Review sách Hackers IELTS Reading Nội dung chính BOOK REVIEW “Hackers IELTS” Giới thiệu chung Ưu điểm Bố cục mỗi bài gồm Khuyết điểm Kết luận BOOK REVIEW  “Hackers IELTS” Tên sách: Hackers IELTS Reading Nhà xuất bản: Nhà xuất bản ...

WRITING SAMPLES: EDUCATION

Vậy nên, hôm nay Vietop sẽ gửi đến bạn bài mẫu EDUCATION Task 1,2 về chủ đề này, cùng xem và lưu lại để ôn tập và rèn luyện kỹ năng IELTS Writing nhé! Task 1:  The charts below show the results of a survey of adult education. The first chart shows the reasons why adults decide to study. The pie chart shows how people think the costs of adult education should be shared. The bar chart displays why adults opted to study, while the pie chart depicts people’s thoughts on the tuition fee distribution of the study mentioned before. Overall, the two primary reasons why individuals have maintained their education, according to the poll results, are because they are interested in subjects and to get a degree. It should also be noted that the majority of school expenditures should be covered by individuals themselves, according to the study. It can be shown that the two primary reasons why adults continue their education are because they are interested in the program and to get ...