Chuyển đến nội dung chính

Muni’s Equity Toolkit Helps Essential Employees Get to Work

Muni’s Equity Toolkit Helps Essential Employees Get to Work
By Mariana Maguire

The latest data from SFMTA’s new Equity Toolkit shows that Muni service changes are helping people in neighborhoods identified by our Muni Service Equity Strategy access more jobs and support the city’s recovery.  

In winter 2020, we launched the SFMTA Equity Toolkit to understand how service decisions are affecting neighborhoods where there is likely a high prevalence of essential workers who rely predominantly on Muni to get to their essential jobs. Our goal is to make better service decisions based on the trends and impacts we see in the Equity Toolkit.  

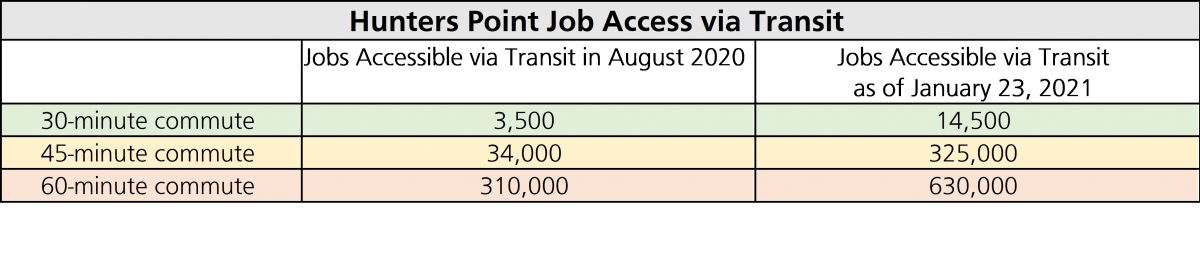
Recently, the greatest increases in access to jobs via Muni have been in Hunters Point and Western Addition. The Hunters Point neighborhood saw the largest gains from the addition of the 15 Bayview-Hunters Point Express, as demonstrated in the table below. Thanks to the return of key Muni lines and increased frequencies on connector routes, Inner Mission, Tenderloin, Oceanview-Ingleside and Treasure Island have also seen increased access to jobs via Muni.  
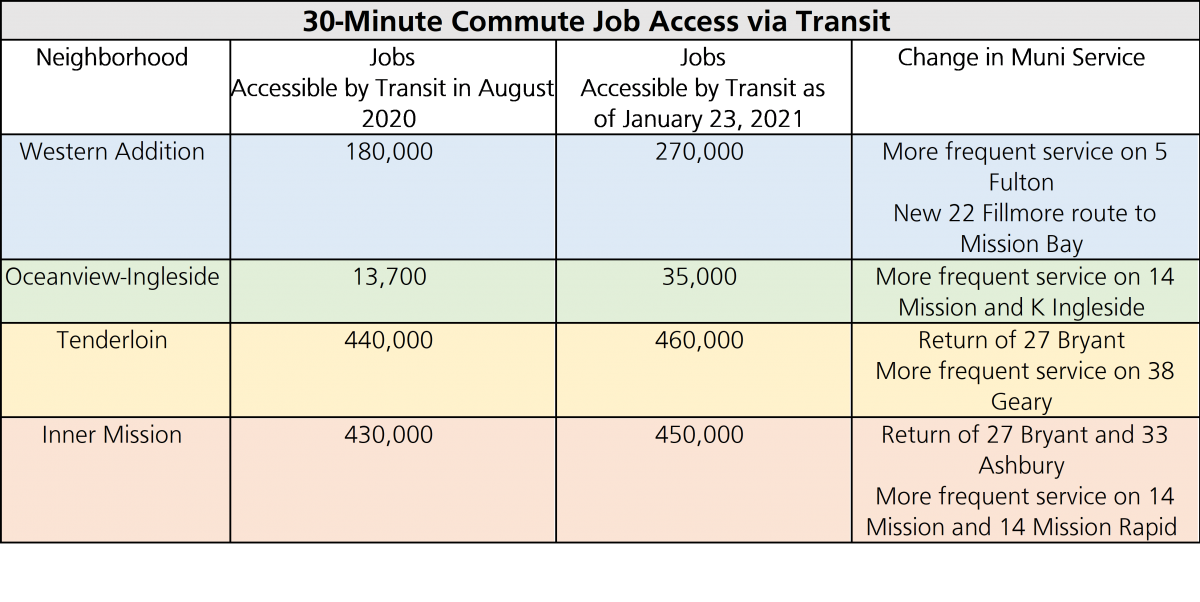
Table title: "30-Minute Commute Job Access via Transit" First row, left to right: column 1 is "Neighborhood", column 2 is "Jobs Accessible by Transit in August 2020", column 3 is "Jobs Accessible by Transit as of January 23, 2021", column 4 is "Change in Muni Service" Second row, left to right: column 1 is "Western Addition", column 2 is "180,000", column 3 is "270,000", column 4 is "More frequent service on 5 Fulton, New 22 Fillmore route to Mission Bay" Third row, left to right: column 1 is "Oceanview-Ingleside", column 2 is "13,700", column 3 is "35,000", column 4 is "More frequent service on 14 Mission and K Ingleside" Fourth row, left to right: column 1 is "Tenderloin", column 2 is "440,000", column 3 is "460,000", column 4 is "Return of 27 Bryant, More frequent service on 38 Geary" Fifth row, left to right: column 1 is "Inner Mission" column 2 is "430,000", column 3 is "450,000", column 4 is "Return of 27 Bryant and 33 Ashbury, More frequent service on 14 Mission and 14 Mission Rapid"

Table title: Hunters Point Job Access via Transit First row, left to right: column 1 is blank, column 2 is "Jobs Accessible via Transit in August 2020", column 3 is "Jobs Accessible via Transit as of January 23, 2021" Second row, left to right: column 1 is "30-minute commute", column 2 is "3,500", column 3 is "14,50o" Third row, left to right: column 1 is "45-minute commute", column 2 is "34,000", column 3 is "325,000" Fourth row, left to right: column 1 is "60-minute commute", column 2 is "310,000", column 3 is "630,000"

Lessons Learned 

The Equity Toolkit also shows some decreases in job access via transit in other neighborhoods identified by the Muni Service Equity Strategy. This reflects the Toolkit’s methodology and/or the impacts of service changes and helps us to understand where we need to make improvements in our data collection, transit service or both. 

Bayview job access increased for commutes of 45 and 60-minutes, but decreased 11% for 30-minute commutes. How can that be? The answer is that the T Third bus substitution was replaced with rail service in December 2020, which makes different and fewer stops than the bus within a 30-minute time period. Overall, Bayview residents are still able to access more jobs now than in August 2020 – roughly 644,500 now compared to 624,000 then, a 3% increase. 

In addition, we rely on fixed points of reference, such as the Bayview Opera House, to gather data and Bayview is a large neighborhood. We learned that using one community landmark for this area is not enough, so we will be adding additional landmarks in future analyses to more accurately capture service change impacts. 

In Visitacion Valley we see decreases in job access via transit across the board. Like in the Bayview, we determined that the issue is both methodology and service. When we redistributed buses from the 8 Bayshore to 8AX to respond to changes in ridership, the community landmark (John King Senior Community) we were using to track the data only showed us the decrease from the 8 Bayshore, not the increase from the 8AX. 

By comparison, more affluent areas show very low to no increases in job access via transit. This reflects our decision to prioritize resources on Muni service for essential workers and essential travel, especially for communities with the fewest options during this unprecedented pandemic. More affluent neighborhoods have more transportation alternatives readily available and more people who are able to work from home. 

These findings give us insights we didn’t have before and help us think about service in new ways. As we learn from the Equity Toolkit we will continue to refine it and make it more detailed by adding more reference points for our data analysis.  

As San Francisco gradually reopens and we continue to add back Muni service, we will also continue to evaluate the impacts through our Equity Toolkit and work to use these insights to inform service adjustments that support our city’s economic recovery. 

Read more about changes to our network on the SFMTA’s Transportation Recovery Plan webpage. 


Published March 31, 2021 at 12:33AM
https://ift.tt/2PkupwH

Nhận xét

Bài đăng phổ biến từ blog này

Writing samples: Physical activities

Luyện thi IELTS Vietop  gửi bạn bài Writing samples: Physical activities   bên dưới nhé! Các bạn theo dõi và ôn luyện  IELTS Writing  thật tốt nhé! Task 1: The bar chart below shows the percentage of Australian men and women in different age groups who did regular physical activity in 2010. The bar chart depicts the percentages of Australian males and females in various age groups who exercised regularly in 2010. Overall, men’s engagement peaked between the ages of 15 and 24, while women’s participation peaked in the 45 to 54 age group. Besides, in every age group save the youngest, more women than men participated in regular exercise. Women in the youngest age group who regularly exercised were 47.7%. After then, their participation increased significantly with age, peaking at 3% over a half in the 45-54 age group. Above that, it began to deteriorate, with only 47.1% of people in the most senior age group engaging in regular workout. The lowest age ...

Review sách Hackers IELTS Reading

Sách “Hackers IELTS” phù hợp cho bạn đang muốn tự ôn luyện tại nhà nhưng không biết nên chọn sách nào học cho hiệu quả và khoa học. Bộ sách “Hackers IELTS” được các chuyên gia tin tưởng giới thiệu cho những bạn chưa biết gì về IELTS, không biết cấu trúc đề thi IELTS gồm những phần nào,…thì “Hackers IELTS” rất phù hợp với những đối tượng này. Xem thêm bài viết đang được quan tâm nhất: Review sách... Bạn hoàn toàn có thể đạt 6.5 IELTS trở lên là điều không khó nếu như bạn biết cách sắp xếp lộ trình học sao cho logic và thêm việc lựa chọn 1 vài tài liệu thực sự hay và dễ học, thì mọi nút thắt đều được gỡ bỏ. Hàng nghìn độc giả đã mua và nêu cảm nhận rất tốt về bộ sách này chính là minh chứng cho việc “Hackers IELTS” sẽ giúp bạn làm được điều mà bạn mong ước. Review sách Hackers IELTS Reading Nội dung chính BOOK REVIEW “Hackers IELTS” Giới thiệu chung Ưu điểm Bố cục mỗi bài gồm Khuyết điểm Kết luận BOOK REVIEW  “Hackers IELTS” Tên sách: Hackers IELTS Reading Nhà xuất bản: Nhà xuất bản ...

WRITING SAMPLES: EDUCATION

Vậy nên, hôm nay Vietop sẽ gửi đến bạn bài mẫu EDUCATION Task 1,2 về chủ đề này, cùng xem và lưu lại để ôn tập và rèn luyện kỹ năng IELTS Writing nhé! Task 1:  The charts below show the results of a survey of adult education. The first chart shows the reasons why adults decide to study. The pie chart shows how people think the costs of adult education should be shared. The bar chart displays why adults opted to study, while the pie chart depicts people’s thoughts on the tuition fee distribution of the study mentioned before. Overall, the two primary reasons why individuals have maintained their education, according to the poll results, are because they are interested in subjects and to get a degree. It should also be noted that the majority of school expenditures should be covered by individuals themselves, according to the study. It can be shown that the two primary reasons why adults continue their education are because they are interested in the program and to get ...