Chuyển đến nội dung chính

New Law Brings Safer Speed Limits to San Francisco

New Law Brings Safer Speed Limits to San Francisco
By Eillie Anzilotti

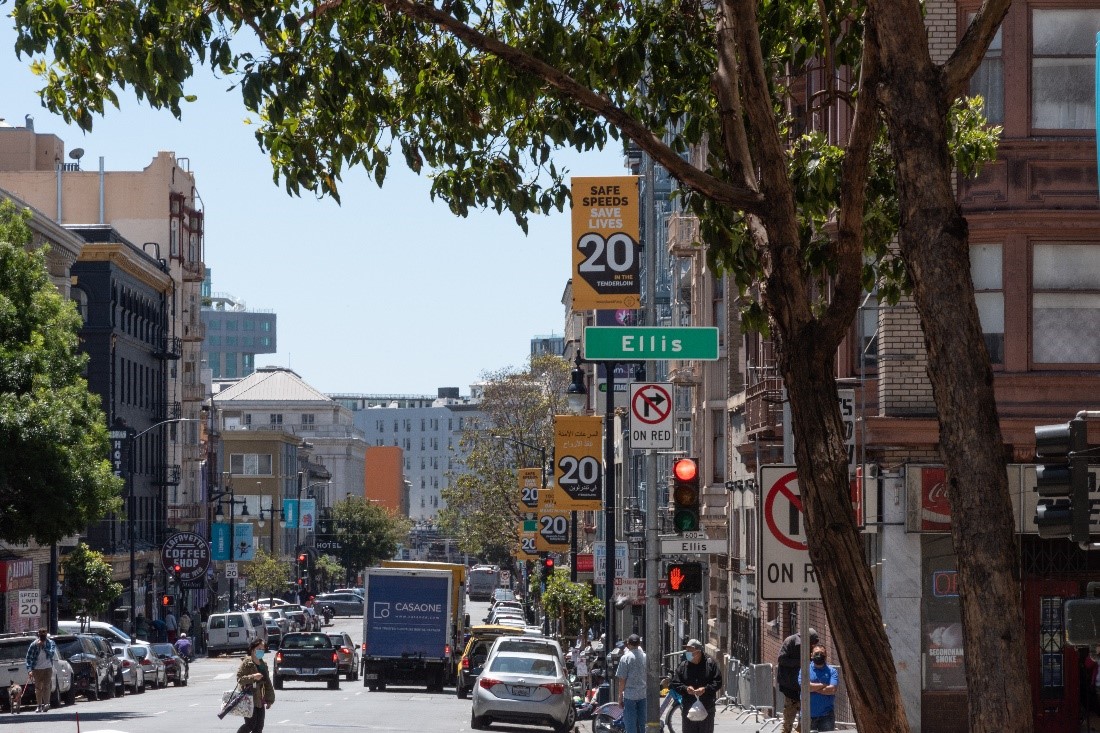
Photo of Ellis Street showing 20 mph speed limit

With the passage of California Assembly Bill 43 (Friedman)—which allows local jurisdictions to reduce speed limits in key areas—San Francisco is poised to make major progress toward our goal of achieving Vision Zero – eliminating traffic-related fatalities.

Because speed is the leading cause of serious and fatal crashes in San Francisco, reducing speeds is the single most effective tool for achieving Vision Zero. Before AB43, cities across California—including San Francisco—were limited in their ability to adjust local speed limits. Even slowing traffic down by 5 mph can make a difference of whether or not someone survives a crash, and AB43 will enable SFMTA to set speeds that promote safer streets for all along key corridors.
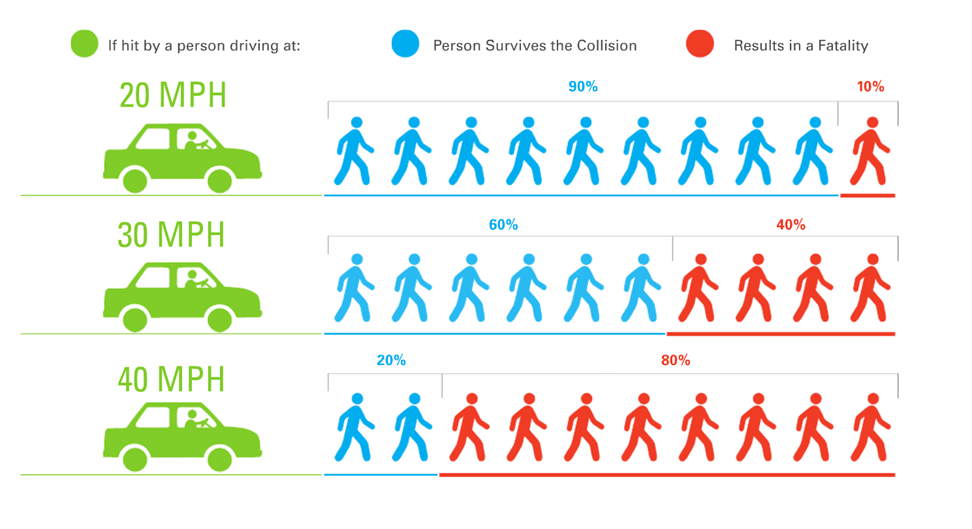
Image shows that if a person is struck by a vehicle driving 20 mph, there is a 90 percent chance that the person survives the collision, and a 10 percent chance that it results in a fatality. If a person is struck by a vehicle driving 30 mph, there is a 60 percent chance that they survive, and a 40 percent chance that the collision results in a fatality. If a person is struck by a vehicle driving 40 mph, there is a 20 percent chance that they survive, and an 80 percent chance that the collision results in a fatality.

The SFMTA will implement the changes authorized through AB43 in two phases. First, under the provision that goes into effect in January 2022, the SFMTA will move to lower speed limits by 5 mph (from 25 mph to 20 mph, or 30 mph to 25 mph) in key business activity districts (streets where at least half of the property uses are dining or retail).

We have mapped out key corridors where these speed reductions will come into effect next year—including Haight, Polk, and Valencia streets—as well as other areas for future consideration. These speed limit changes still require SFMTA Board approval, and staff will be bringing them a proposal with an implementation plan for the first seven corridors in December. These first seven corridors for speed limit reductions from 25 to 20 mph include:

  • 24th Street, from Diamond to Chattanooga streets and from Valencia to San Bruno Avenue;
  • Fillmore Street, from Chestnut to Union streets and from Jackson to McAllister streets;
  • Haight Street, from Stanyan Street to Central Avenue and from Webster to Steiner streets;
  • Polk Street, from Filbert to Sutter streets;
  • Ocean Avenue, from Geneva Avenue to Victoria Street and from Junipero Serra Boulevard to 19th Avenue;
  • San Bruno Avenue, from Silver to Paul avenues; and
  • Valencia Street, from Cesar Chavez to Market streets

We plan to accompany the rollout of the new speed limits along the streets with public education and outreach campaign on the importance of slow speeds for saving lives. We will return to the SFMTA Board in 2022 with additional proposed speed limit reductions that are eligible as business activity districts.
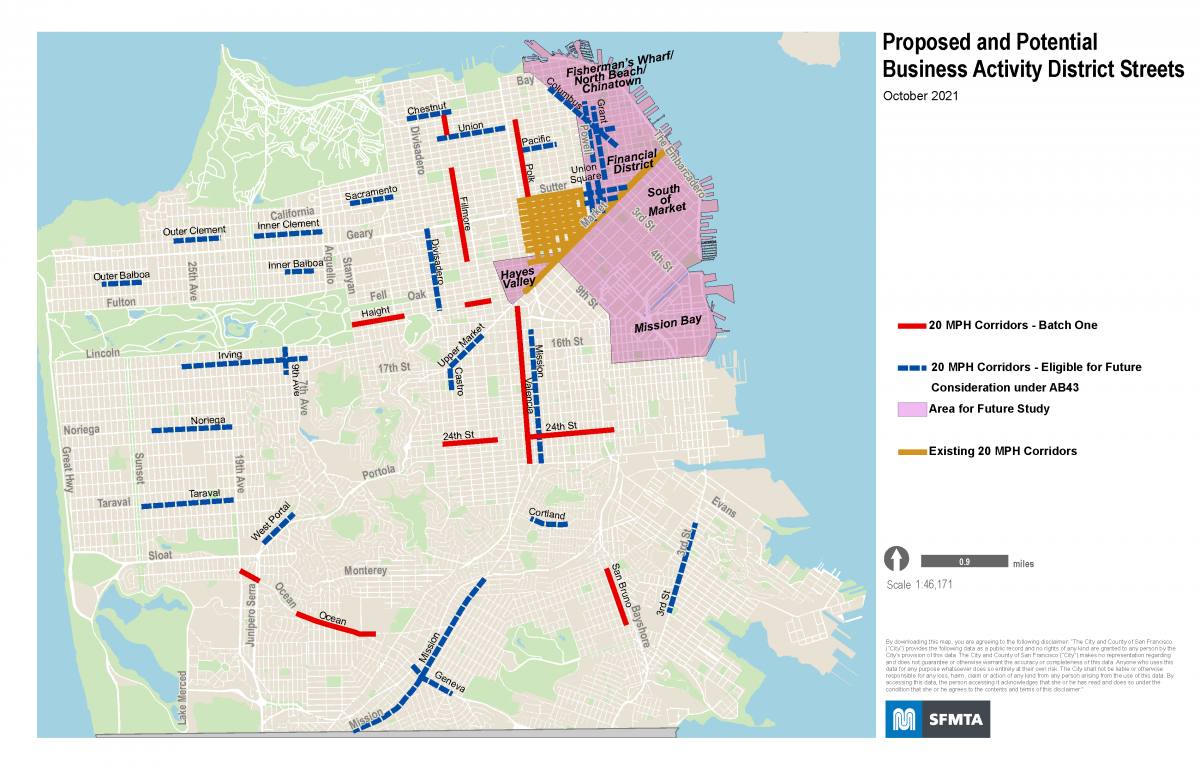
Map of proposed and potential business activity district streets. 20 MPH corridors identified as Batch One include stretches of Fillmore, Haight, 24th, Polk and Valencia streets, Sn Bruno Avenue, Ocean Avenue. 20 MPH corridors identified as "eligible for future consideration under AB43" include sections of inner and outer Clement, inner and outer Balboa, Chestnut, Union, Pacific, Columbus, Grant, Powell, Geary, O'Farrell, Divisadero, 9th Avenue, Upper Market, inner Mission, Irving, Noriega, Taraval, West Portal, outer Mission, Cortland, Geneva and Third Street. Neighborhoods marked on the map as "Area for Future Study" include Fisherman's Wharf/North Beach/Chinatown, Financial District, South of Market, Hayes Valley, and Mission Bay. Areas on the map marked as "Existing 20 MPH corridors" include Market Street, and all streets in the Tenderloin bounded west by Van Ness Avenue, north by Sutter Street, East by Mason, and south by Market Street.

The second phase will be implementing another portion of the bill that authorizes the city to lower speeds by 5 mph on streets that are designated as “safety corridors”—streets that have the highest number of serious injuries and fatalities. In San Francisco, 75% of serious and fatal collisions occur on just 13% of city streets.  This is especially important for advancing equity in San Francisco, as over half of corridors on the High Injury Network are in a Community of Concern. This particular aspect of the bill does not come into effect until June 2024, though, and requires the California Department of Transportation (Caltrans) to establish definitions of “safety corridors” through its roadway standards manual.

We have already implemented 20 mph limits throughout the Tenderloin, where every street is on the High Injury Network, and will continue to prioritize improvements in Communities of Concern.

In our upcoming 2021 Vision Zero Action Strategy, the SFMTA is committing San Francisco to a comprehensive approach to lowering speeds on key corridors across the city. We will continue to pair speed limit reductions with our existing strategies, like the Vision Zero Quick-Build Program, to slow speeds on our streets.

We appreciate the leadership of Assembly Transportation Committee Chair Laura Friedman, along with San Francisco co-sponsors Assemblymember David Chiu and Assemblymember Phil Ting in introducing this transformative legislation.  Their leadership along with Mayor Breed, the Board of Supervisors,  WalkSF,  SF Bike Coalition, and San Francisco Bay Area Families for Safe Streets and all the many citizens who wrote letters, called into hearings and tweeted their support for this important step to address speeding on our streets, were essential to its success.  We stand committed to safer streets in SF and will work urgently to reduce speed limits to save lives.


Published October 29, 2021 at 05:33AM
https://ift.tt/2ZEDB4b

Nhận xét

Bài đăng phổ biến từ blog này

Writing samples: Physical activities

Luyện thi IELTS Vietop  gửi bạn bài Writing samples: Physical activities   bên dưới nhé! Các bạn theo dõi và ôn luyện  IELTS Writing  thật tốt nhé! Task 1: The bar chart below shows the percentage of Australian men and women in different age groups who did regular physical activity in 2010. The bar chart depicts the percentages of Australian males and females in various age groups who exercised regularly in 2010. Overall, men’s engagement peaked between the ages of 15 and 24, while women’s participation peaked in the 45 to 54 age group. Besides, in every age group save the youngest, more women than men participated in regular exercise. Women in the youngest age group who regularly exercised were 47.7%. After then, their participation increased significantly with age, peaking at 3% over a half in the 45-54 age group. Above that, it began to deteriorate, with only 47.1% of people in the most senior age group engaging in regular workout. The lowest age ...

Review sách Hackers IELTS Reading

Sách “Hackers IELTS” phù hợp cho bạn đang muốn tự ôn luyện tại nhà nhưng không biết nên chọn sách nào học cho hiệu quả và khoa học. Bộ sách “Hackers IELTS” được các chuyên gia tin tưởng giới thiệu cho những bạn chưa biết gì về IELTS, không biết cấu trúc đề thi IELTS gồm những phần nào,…thì “Hackers IELTS” rất phù hợp với những đối tượng này. Xem thêm bài viết đang được quan tâm nhất: Review sách... Bạn hoàn toàn có thể đạt 6.5 IELTS trở lên là điều không khó nếu như bạn biết cách sắp xếp lộ trình học sao cho logic và thêm việc lựa chọn 1 vài tài liệu thực sự hay và dễ học, thì mọi nút thắt đều được gỡ bỏ. Hàng nghìn độc giả đã mua và nêu cảm nhận rất tốt về bộ sách này chính là minh chứng cho việc “Hackers IELTS” sẽ giúp bạn làm được điều mà bạn mong ước. Review sách Hackers IELTS Reading Nội dung chính BOOK REVIEW “Hackers IELTS” Giới thiệu chung Ưu điểm Bố cục mỗi bài gồm Khuyết điểm Kết luận BOOK REVIEW  “Hackers IELTS” Tên sách: Hackers IELTS Reading Nhà xuất bản: Nhà xuất bản ...

WRITING SAMPLES: EDUCATION

Vậy nên, hôm nay Vietop sẽ gửi đến bạn bài mẫu EDUCATION Task 1,2 về chủ đề này, cùng xem và lưu lại để ôn tập và rèn luyện kỹ năng IELTS Writing nhé! Task 1:  The charts below show the results of a survey of adult education. The first chart shows the reasons why adults decide to study. The pie chart shows how people think the costs of adult education should be shared. The bar chart displays why adults opted to study, while the pie chart depicts people’s thoughts on the tuition fee distribution of the study mentioned before. Overall, the two primary reasons why individuals have maintained their education, according to the poll results, are because they are interested in subjects and to get a degree. It should also be noted that the majority of school expenditures should be covered by individuals themselves, according to the study. It can be shown that the two primary reasons why adults continue their education are because they are interested in the program and to get ...