By Erica Kato
With Vision Zero, our goal is straight-forward: traffic deaths are not just preventable, they’re unacceptable and we must work to eliminate them. One death on our streets due to traffic violence is one death too many.
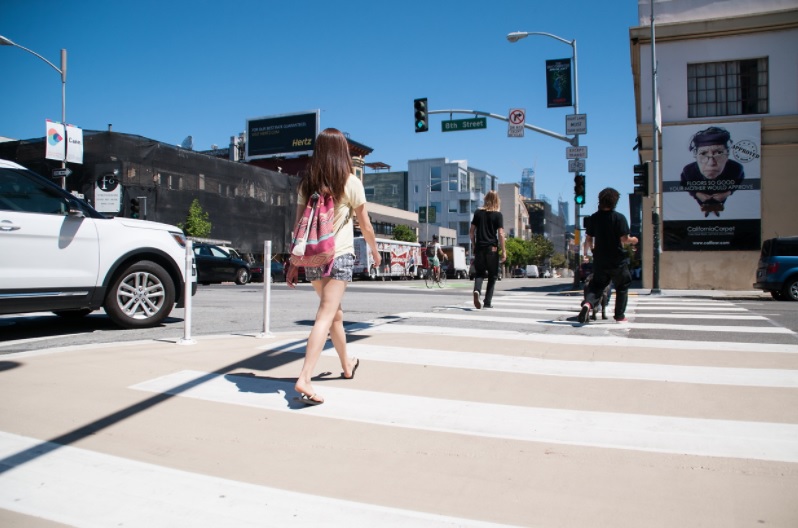
People using pedestrian safety zone on 8th Street that creates a shorter and safer crosswalk
The advent of the COVID-19 pandemic in early 2020 had a significant and unprecedented impact on travel in San Francisco throughout the year. Unfortunately, as traffic volumes dropped, we witnessed an increase in both traffic speeds and dangerous driving behavior. While the number of traffic injuries in San Francisco decreased in 2020 compared to 2019, the number of traffic deaths remained tragically unchanged.
Nationally, traffic fatalities have increased in major cities, including many of our Vision Zero peers like Portland, New York City and Philadelphia. In San Francisco we experienced an increase in solo-driver fatalities and motorcycle fatalities, and a decrease in pedestrian fatalities.
First adopted by the mayor and the Board of Supervisors in 2014, the aim of Vision Zero is to eliminate traffic deaths and reduce severe injuries in San Francisco. The policy remains the guiding safety principle for SFMTA, as well as for our partners in the Department of Public Health, the San Francisco Police Department, and all of our Vision Zero partners.
Despite the pandemic and local shelter-in-place orders, the SFMTA completed more than 80 miles of street safety improvements citywide in 2020. More than 30 miles of these improvements were made on the High Injury Network (a network of streets that accounts for 75% of severe and fatal traffic collisions). This includes 6.5 new miles of protected bikeways, more than 300 continental crosswalk upgrades, 11 miles of city streets with slower speed limits, more than 150 signals upgraded additional crossing time for people walking, and more than 60 signals upgraded with leading pedestrian intervals.
We are committed to reaching our Vision Zero goal of zero fatalities in San Francisco.
Our Vision Zero approach in 2021:
Looking ahead, we will continue focusing in 2021 on proven tools to save lives, especially focused on slowing speeds since speed is a leading factor in severe and fatal injuries in SF. These tools include:
-
- Exercising local authority to slow speeds, including establishing slow senior zones and 20 MPH speed limits on Market Street and other High Injury Network streets
- Advancing quick build projects (more than 10 quick builds are in the pipeline for 2021, including two in the Tenderloin)
- Implementing citywide programmatic work on the High Injury Network, such as daylighting (removing parking at intersections to improve visibility).
We know we can’t get to zero deaths from traffic crashes without a transformative policy agenda, so we will continue to pursue state legislative change to give us more authority over how speed limits are set in San Francisco and to see the ability to implement speed safety cameras for enforcement.
San Francisco’s multiagency, multidisciplinary team will be updating the Vision Zero Action Strategy in 2021. We want to know your ideas and priorities for safer streets and will be sharing a survey soon to gather your input.
For more information, please visit our website: visionzerosf.org
Published February 03, 2021 at 11:33PM
https://ift.tt/3pRqbda
Nhận xét
Đăng nhận xét