Chuyển đến nội dung chính

A Decade of Rolling out the Red Carpet for Riders

A Decade of Rolling out the Red Carpet for Riders
By Cassie Halls

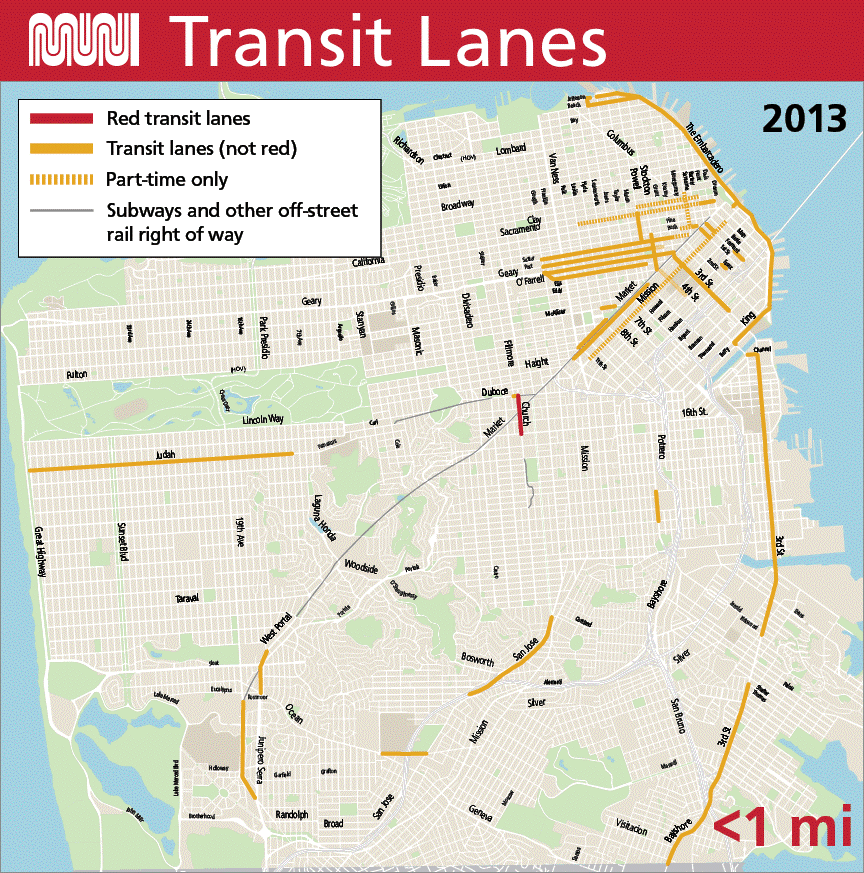
 A map showing the expansion of transit lanes in San Francisco from 2103 to 2023, as well as lanes that are coming soon. A summary of key highlights from the map is included in the following link.

An animated map showing the expansion of red transit lanes in San Francisco. View as a PDF. Accessible version of the expansion of red transit lanes: 

Red Transit Lanes Over Time in San Francisco from 2013 to 2023 

There is nothing quite like looking out the window at gridlock traffic while your bus coasts down a red transit lane. This may feel like an “only in San Francisco” pleasure – after all, San Francisco was one of the first U.S. cities to “roll out the red carpet” by painting bus lanes red. But red transit lanes have now become a popular way to keep buses out of traffic in more than 25 cities across the country. 

The SFMTA is celebrating a decade since the installation of San Francisco’s first red transit lane on Church Street on March 23, 2013. You can help us celebrate by riding that first red transit lane between Duboce and 16th Streets on Muni’s 22 Fillmore and J Church along with thousands of other weekday riders. As you whiz past traffic, you may feel the estimated 14% time savings afforded by the red color.  

If you drive, help us celebrate by keeping transit lanes clear. Remember, double parking in transit lanes is camera enforced. Transit lanes are an essential tool to keep Muni moving on San Francisco’s busy streets.  

Dedicated transit lanes started popping up in the city as early as the 1970s following the adoption of the city’s Transit-First Policy (which happens to be turning 50 this month). As of 2023, over 20 lane miles of transit lanes now also have the red treatment, in addition to 55 miles of transit and bus/HOV lanes without red paint.  
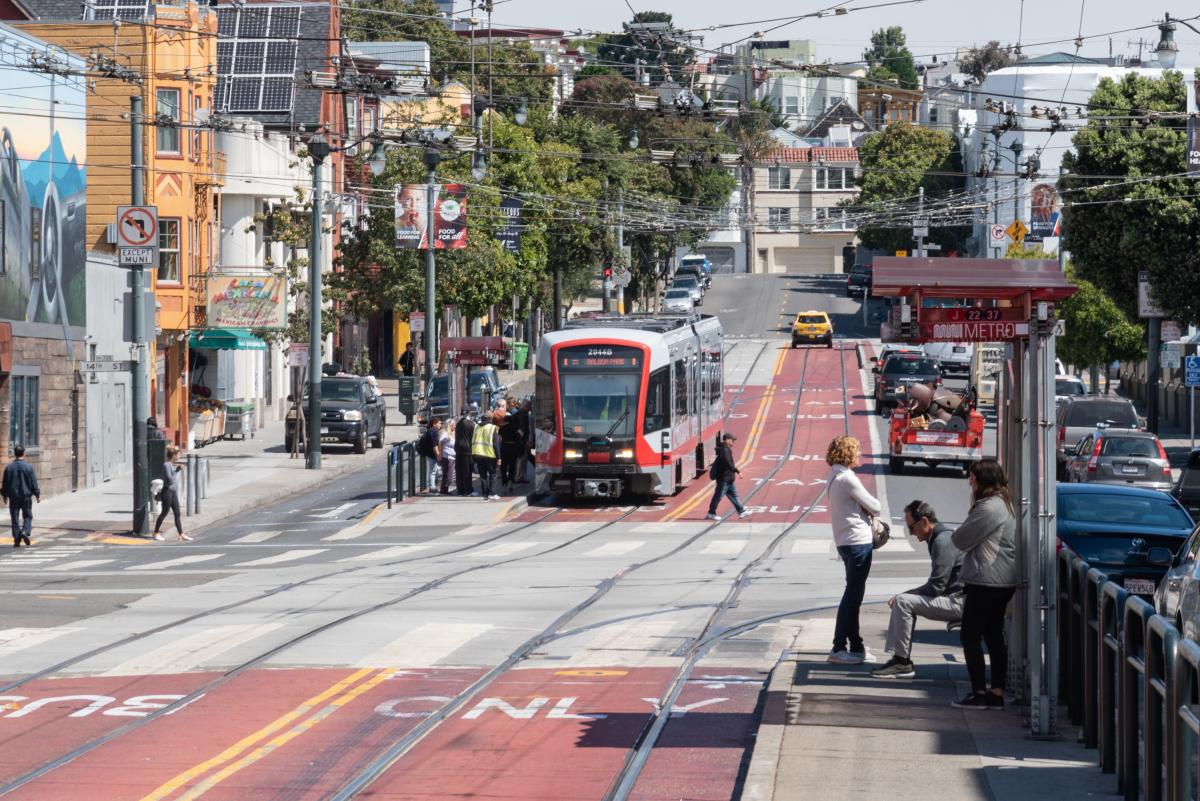
J Church using red transit lanes and picking up passengers on a boarding island on Church at Market Street.

J Church train using red transit lanes on Church at Market Street. 

Although often the most visible, transit lanes are one of more than 20 tools in our toolbox to improve transit reliability and reduce delays. With Muni Forward, we’ve built more than 80 miles of transit corridor reliability improvements to keep Muni moving — with upgrades like bus bulbs for faster boarding and traffic signals that stay green for transit.  

As an early adopter of red transit lanes, the SFMTA helped lay the groundwork to change federal guidelines to make it easier to paint lanes red. This is because red colorization has led to a 55% improvement in motorist compliance and is a cost-effective way to reduce delays. We have to say they’re looking great for their age! 

We know that despite our best efforts, Muni buses and trains are sometimes stuck in traffic and transit lanes are occasionally blocked. That is why we continue to innovate to bring improvements to our riders. Last year we colorized six miles of transit lanes in the Van Ness Improvement Project, Geary Boulevard Improvement Project, and along Mission Street in SoMa, 4th Street and Stockton Street. We also continue to install Muni Forward transit priority projects across the city and push for further compliance improvements through an education campaign for motorists. The SFMTA was also recently awarded a state grant to deploy new next-generation camera technology as a part of the transit lane enforcement program. 

Stay tuned for more red transit lanes and other reliability improvements in the year ahead.  


Published March 22, 2023 at 03:35AM
https://ift.tt/9XoMCqz

Nhận xét

Bài đăng phổ biến từ blog này

Writing samples: Physical activities

Luyện thi IELTS Vietop  gửi bạn bài Writing samples: Physical activities   bên dưới nhé! Các bạn theo dõi và ôn luyện  IELTS Writing  thật tốt nhé! Task 1: The bar chart below shows the percentage of Australian men and women in different age groups who did regular physical activity in 2010. The bar chart depicts the percentages of Australian males and females in various age groups who exercised regularly in 2010. Overall, men’s engagement peaked between the ages of 15 and 24, while women’s participation peaked in the 45 to 54 age group. Besides, in every age group save the youngest, more women than men participated in regular exercise. Women in the youngest age group who regularly exercised were 47.7%. After then, their participation increased significantly with age, peaking at 3% over a half in the 45-54 age group. Above that, it began to deteriorate, with only 47.1% of people in the most senior age group engaging in regular workout. The lowest age ...

Review sách Hackers IELTS Reading

Sách “Hackers IELTS” phù hợp cho bạn đang muốn tự ôn luyện tại nhà nhưng không biết nên chọn sách nào học cho hiệu quả và khoa học. Bộ sách “Hackers IELTS” được các chuyên gia tin tưởng giới thiệu cho những bạn chưa biết gì về IELTS, không biết cấu trúc đề thi IELTS gồm những phần nào,…thì “Hackers IELTS” rất phù hợp với những đối tượng này. Xem thêm bài viết đang được quan tâm nhất: Review sách... Bạn hoàn toàn có thể đạt 6.5 IELTS trở lên là điều không khó nếu như bạn biết cách sắp xếp lộ trình học sao cho logic và thêm việc lựa chọn 1 vài tài liệu thực sự hay và dễ học, thì mọi nút thắt đều được gỡ bỏ. Hàng nghìn độc giả đã mua và nêu cảm nhận rất tốt về bộ sách này chính là minh chứng cho việc “Hackers IELTS” sẽ giúp bạn làm được điều mà bạn mong ước. Review sách Hackers IELTS Reading Nội dung chính BOOK REVIEW “Hackers IELTS” Giới thiệu chung Ưu điểm Bố cục mỗi bài gồm Khuyết điểm Kết luận BOOK REVIEW  “Hackers IELTS” Tên sách: Hackers IELTS Reading Nhà xuất bản: Nhà xuất bản ...

WRITING SAMPLES: EDUCATION

Vậy nên, hôm nay Vietop sẽ gửi đến bạn bài mẫu EDUCATION Task 1,2 về chủ đề này, cùng xem và lưu lại để ôn tập và rèn luyện kỹ năng IELTS Writing nhé! Task 1:  The charts below show the results of a survey of adult education. The first chart shows the reasons why adults decide to study. The pie chart shows how people think the costs of adult education should be shared. The bar chart displays why adults opted to study, while the pie chart depicts people’s thoughts on the tuition fee distribution of the study mentioned before. Overall, the two primary reasons why individuals have maintained their education, according to the poll results, are because they are interested in subjects and to get a degree. It should also be noted that the majority of school expenditures should be covered by individuals themselves, according to the study. It can be shown that the two primary reasons why adults continue their education are because they are interested in the program and to get ...