By Christopher Ward
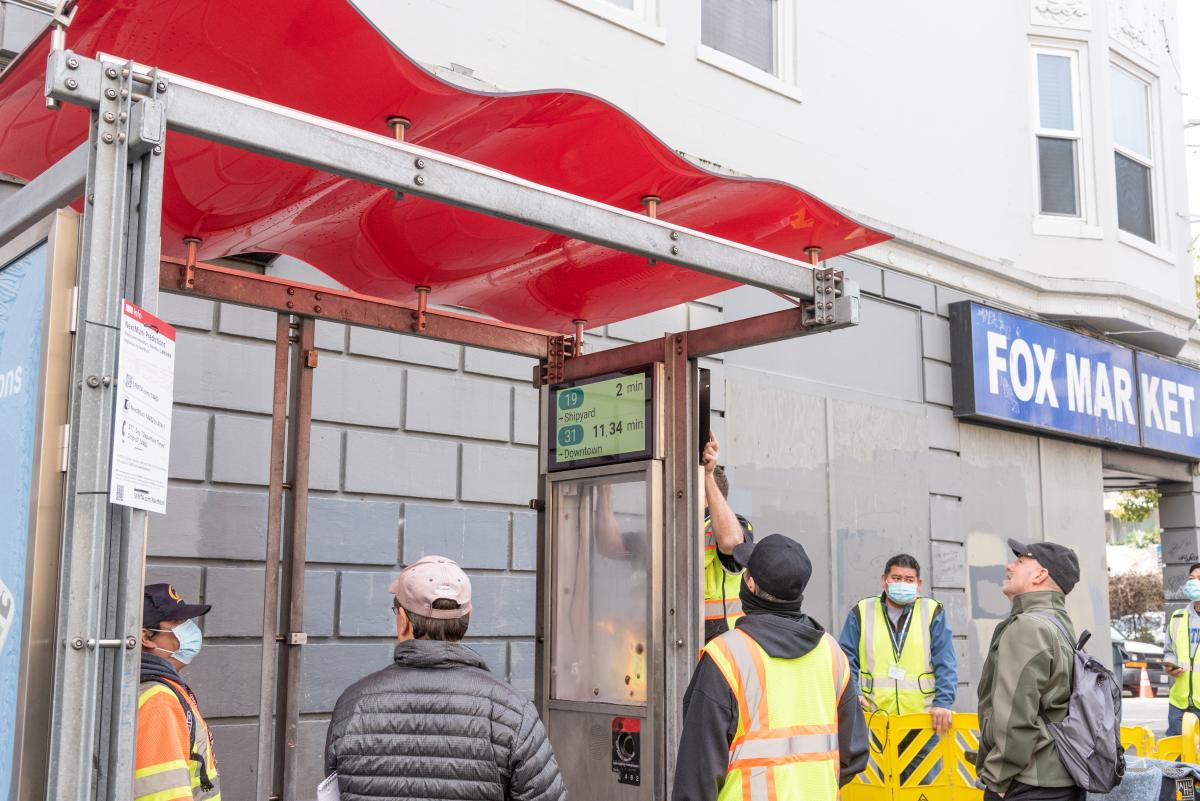 New Customer Information Systems are being installed and causing customer curiosity!
Got a burning question about the SFMTA’s Muni predictions that are made by our Next Generation Customer Information System (CIS)? We’ve got answers! Below are some of the frequently asked questions from Muni customers. Send us yours!
Where do Muni predictions come from?
Muni predictions come from data provided by multiple SFMTA systems including equipment on our vehicles. Real-time predictions are based on the real-time locations of Muni vehicles. A computer algorithm compares the real-time data to past travel times based on time of day, day of week, season and other factors that affect travel to predict future arrival times. Travel patterns in this historic data are applied to real-time data to generate accurate Muni predictions.
When the system has no real-time information, it uses Muni schedules to make predictions. This often occurs at or near terminals and during service changes. However, schedule data isn’t as reliable as real-time data, particularly because the SFMTA has made Muni service more reliable by shifting away from using schedules to headway management, scheduling service at regularly spaced intervals to reduce gaps and bunching, rather than clock times.
What factors impact predictions?
The two main problems with predictions are 1) vehicles in service but not showing up in the Customer Information System (we call those “surprise vehicles”) and 2) predictions made from the schedule, but the vehicle doesn't show up (we call those “ghost vehicles”).
A “surprise vehicle” is when a bus or train is running but it is not picked up by the real-time position data feed. This may be because of damaged equipment, a vehicle not signed into the system when it departs the division, or when changes are not entered into the system. When a vehicle is missing from the system, the wait times at stops appear longer than they actually will be. This happens because the prediction system does not “see” one of the vehicles.
A “ghost vehicle” usually occurs at stops close to the start of the line. You might see this at the stop when looking at the prediction countdown. When the count gets to zero, no vehicle appears! This happens because the prediction system is not picking up any vehicles while they are at the terminal and before they start the route. This results in the countdown relying on the schedule, even if the vehicle is delayed. If a vehicle is scheduled but not coming, then the countdown will end and there will be no vehicle. The system relies on the vehicle data when it is available, otherwise it will show the schedule information that may not be accurate.
The same problem occurs with trains as with buses but at an increased rate, because trains cannot pass each other like buses. Because of this, there are often service adjustments made at the control center to manage gaps that result in inaccurate predictions.
Why do different apps have different predictions sometimes?
The SFMTA generates vehicle information and shares this data openly for anyone to use cost-free. Third party apps like Transit, Google and Waze, as well as “mom and pop” apps, each have their own way of taking in and making use of the data that we provide.
These third parties are independent of the SFMTA and we do not keep track of the quality of their predictions. If customers experience problems, we recommend reporting the problem directly to the third-party and checking the predictions at SFMTA.com/Routes.
What does it mean when a Muni display says, “no predictions available?”
The “no predictions” message displays when there is no real-time vehicle data to generate predictions, either because the system is down or a vehicle is not logged into the system. This does not mean that isn’t service. Buses and trains are still running. If there is a service issue affecting bus or train operation, the SFMTA will display relevant information, make audio announcements, send out email and SMS alerts and post on Twitter.
What new features will be added and how can I learn more?
The Next Generation CIS screens now display real-time vehicle locations on a map and real-time on-board vehicle capacity information, along with arrival prediction times.
Some of the next features we plan to roll out are real-time alerts such as reroutes and elevator availability. We’re also improving terminal predictions, and we are working on multiple MuniMobile app upgrades.
For more information visit our CIS project and System Updates websites!
Published March 13, 2023 at 11:57PM
https://ift.tt/eGYm531
Nhận xét
Đăng nhận xét