Chuyển đến nội dung chính

Just in Time for Bike Month: The Active Communities Plan Interactive Map!

Just in Time for Bike Month: The Active Communities Plan Interactive Map!
By Christopher Kidd

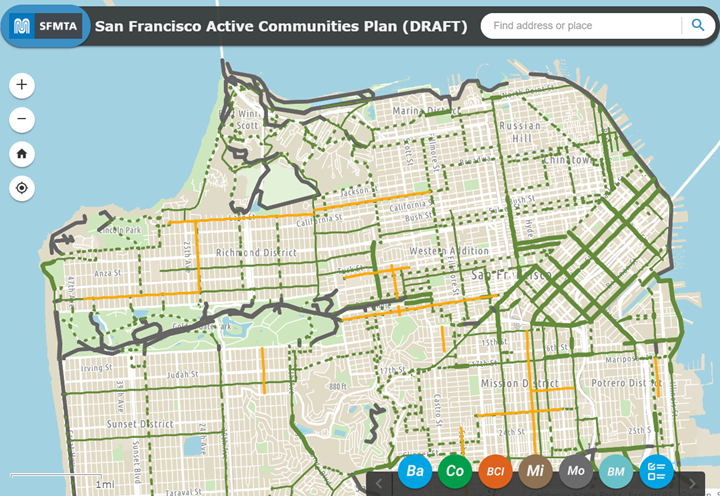
Image of a map with multiple lines seen. The legend on the bottom right includes about a half a dozen circles.

Image of the new Active Communities Plan (ACP ) interactive map 

As part of our ongoing public outreach about the Active Communities Plan, the SFMTA has created a new ACP interactive map.  The release of the map comes just a couple of weeks after we began collecting feedback through our new survey.  

The map shows conditions for biking, scooting and rolling across San Francisco, as well as multiple layers of analysis conducted by the Active Communities Plan team. It is meant to help users understand how different factors like comfort, safety and network quality influence whether people decide to use active transportation or not.  

We want users to have the opportunity to explore and compare data, reflect on how it compares to their experiences with active transportation and provide input about what kinds of solutions work best. 

The interactive map has six main layers to explore: 

  • Baseline Data – shows today’s active transportation network, our pipeline of approved projects and the location of every public bike rack in the city. 
  • Collision Analysis – shows the locations of bike and scooter collisions on the High Injury Network before the pandemic (2017-2019) and since the start of the pandemic (2020-2021), as well as the neighborhoods with the most unreported (unlinked) bike & scooter collisions. 
  • Comfort Analysis – shows the Bike Network Comfort Index (BCI), which categorizes perceived comfort or risk by people biking, scooting or rolling. This is only our first draft of the BCI – by taking our survey, you can help shape how the BCI is scored! 
  • Micromobility Analysis – shows what streets people ride most when using BayWheels e-bikes or scooters, which BayWheels stations get the most ridership and the service areas for our micromobility providers. 
  • Modeshare Analysis – shows data from the American Communities Survey: commute mode share by bicycle and the distribution of zero-car households. 
  • Bike and Micromobility Activity Analysis – combines our BayWheels e-bike trip data, scooter trip data and modeled bike and scooter trip data from Replica to estimate the volume of trip activity. You can view activity across the city, on the active transportation network or by network facility type. 

Once you’ve had a chance to explore our interactive maps, take our survey. The results will help us understand your needs and barriers to active transportation, as well as how safe or comfortable people feel using different types of streets. From there we can develop network, program and policy recommendations that directly reflect the needs and priorities of people across the city. Our survey runs through July 31st.  

The Active Communities Plan public engagement effort has reached more than 1,000 residents since January, and we have events scheduled through mid-June with more to come throughout the summer. Visit Active Communities Plan (SFMTA.com/ActiveCommunities) for our schedule, which is updated regularly. If you want us to attend your community meeting or event, contact ActiveCommunities@sfmta.com and let us know! 


Published May 03, 2023 at 09:19PM
https://ift.tt/hBQmW6A

Nhận xét

Bài đăng phổ biến từ blog này

Writing samples: Physical activities

Luyện thi IELTS Vietop  gửi bạn bài Writing samples: Physical activities   bên dưới nhé! Các bạn theo dõi và ôn luyện  IELTS Writing  thật tốt nhé! Task 1: The bar chart below shows the percentage of Australian men and women in different age groups who did regular physical activity in 2010. The bar chart depicts the percentages of Australian males and females in various age groups who exercised regularly in 2010. Overall, men’s engagement peaked between the ages of 15 and 24, while women’s participation peaked in the 45 to 54 age group. Besides, in every age group save the youngest, more women than men participated in regular exercise. Women in the youngest age group who regularly exercised were 47.7%. After then, their participation increased significantly with age, peaking at 3% over a half in the 45-54 age group. Above that, it began to deteriorate, with only 47.1% of people in the most senior age group engaging in regular workout. The lowest age ...

Review sách Hackers IELTS Reading

Sách “Hackers IELTS” phù hợp cho bạn đang muốn tự ôn luyện tại nhà nhưng không biết nên chọn sách nào học cho hiệu quả và khoa học. Bộ sách “Hackers IELTS” được các chuyên gia tin tưởng giới thiệu cho những bạn chưa biết gì về IELTS, không biết cấu trúc đề thi IELTS gồm những phần nào,…thì “Hackers IELTS” rất phù hợp với những đối tượng này. Xem thêm bài viết đang được quan tâm nhất: Review sách... Bạn hoàn toàn có thể đạt 6.5 IELTS trở lên là điều không khó nếu như bạn biết cách sắp xếp lộ trình học sao cho logic và thêm việc lựa chọn 1 vài tài liệu thực sự hay và dễ học, thì mọi nút thắt đều được gỡ bỏ. Hàng nghìn độc giả đã mua và nêu cảm nhận rất tốt về bộ sách này chính là minh chứng cho việc “Hackers IELTS” sẽ giúp bạn làm được điều mà bạn mong ước. Review sách Hackers IELTS Reading Nội dung chính BOOK REVIEW “Hackers IELTS” Giới thiệu chung Ưu điểm Bố cục mỗi bài gồm Khuyết điểm Kết luận BOOK REVIEW  “Hackers IELTS” Tên sách: Hackers IELTS Reading Nhà xuất bản: Nhà xuất bản ...

WRITING SAMPLES: EDUCATION

Vậy nên, hôm nay Vietop sẽ gửi đến bạn bài mẫu EDUCATION Task 1,2 về chủ đề này, cùng xem và lưu lại để ôn tập và rèn luyện kỹ năng IELTS Writing nhé! Task 1:  The charts below show the results of a survey of adult education. The first chart shows the reasons why adults decide to study. The pie chart shows how people think the costs of adult education should be shared. The bar chart displays why adults opted to study, while the pie chart depicts people’s thoughts on the tuition fee distribution of the study mentioned before. Overall, the two primary reasons why individuals have maintained their education, according to the poll results, are because they are interested in subjects and to get a degree. It should also be noted that the majority of school expenditures should be covered by individuals themselves, according to the study. It can be shown that the two primary reasons why adults continue their education are because they are interested in the program and to get ...