By Bonnie Jean von Krogh
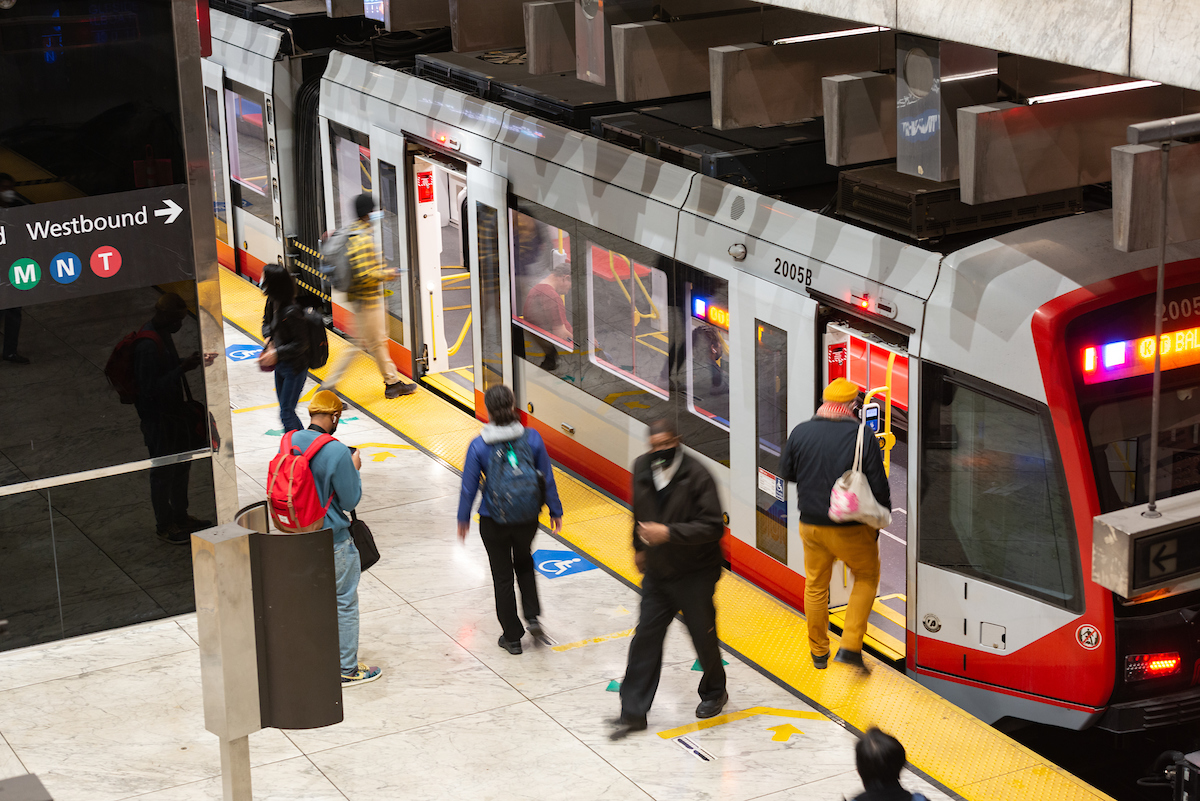
Here at the SFMTA, we are focused on creating the fastest, safest and most reliable public transportation network for all San Franciscans. This is why we consider it a top priority to hear from our riders and non-riders alike about how we’re doing, what your public transportation priorities are, and ways we can improve. These findings help to inform budget, long-range planning and policy decisions. They also help build a better Muni for everyone traveling in San Francisco.
In recent months we conducted our Rider Survey as well as a broader Community Survey. Real-time data from our partners at Transit App in their North America Transit Rider Happiness Benchmarking Survey provides additional details about community feedback.
The good news? Rider satisfaction with Muni services is up across the board:
- Per SFMTA’s Rider survey, 66% of Muni riders rate services as good or excellent — a 9% increase from 2021.
- The City Survey shows Muni’s rating at its highest level since 2013
- Transit App’s survey shows Muni in the Top 5 North American cities when it comes to ranking riders most likely to recommend their public transit system to a friend
- Transit App also shows that Muni riders give our drivers the highest overall approval rating across North America. Go, operators!
- Finally, the Community Survey showcases that our riders have a much higher approval rating for the SFMTA than non-riders.
So if you haven’t ridden Muni in a while, maybe it’s time to give it a try.
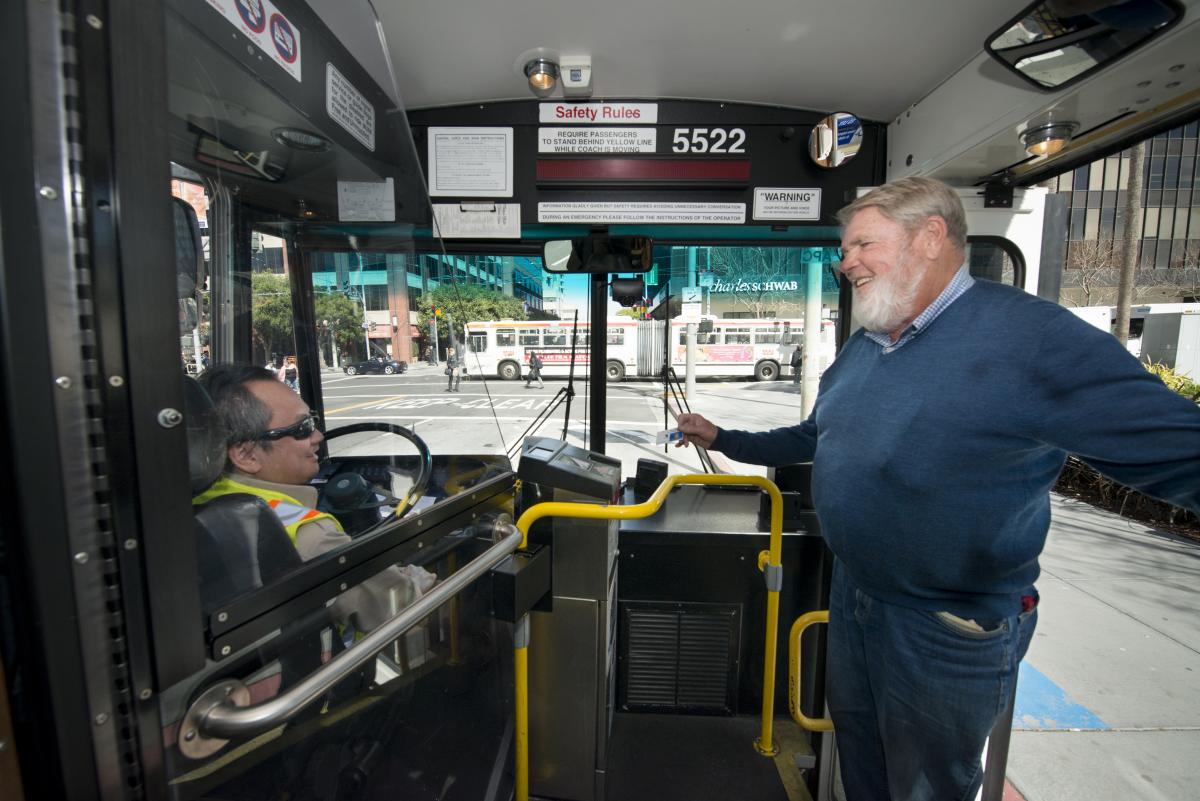
Highlights from the Community Survey
- 71% of riders approve of the SFMTA compared to 48% of non-riders.
- 66% of riders rate Muni service as excellent/good compared to 48% of non-riders.
- By 9 points, regular riders also consider Muni safer than non-riders
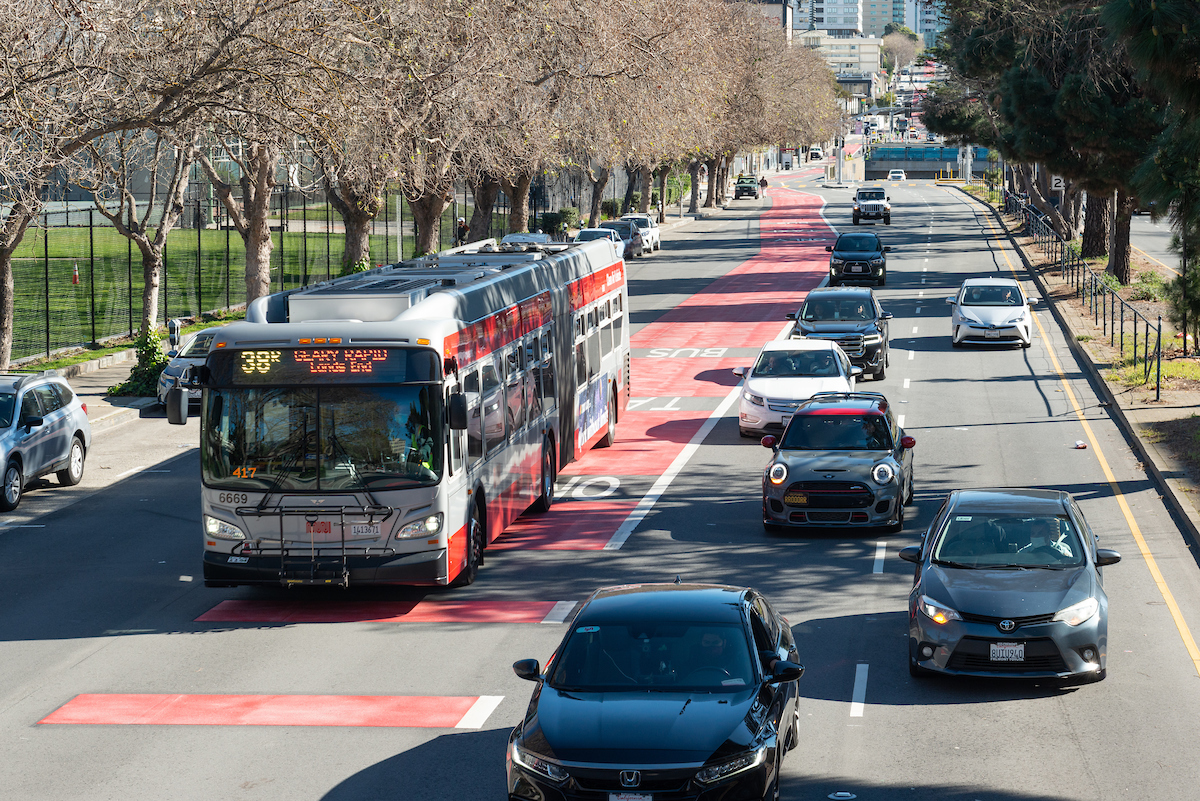
Our Rider Survey shows us that customers have noticed the work Muni has been doing to address service delivery since the onset of the pandemic. Our ongoing investments in reliability improvements such as transit lanes, bus bulbs and smart traffic signals have also paid off. Over the last three years, we implemented over 21 miles of new transit lanes, bringing our transit lane network to more than 70 miles! With this expansion, Muni is quicker and more reliable than it has been in decades.
That said, there’s more to be done, and respondents continue to emphasize “Improving the speed, frequency and reliability of Muni buses and trains,” with two-thirds of respondents prioritizing, “having the most frequent and reliable buses and trains, even if stops are more than 2 or 3 blocks away, rather than having closer stops.”
Next Steps
We asked what our community would most like to see changed, and while answers varied, the top priorities according to the Community Survey are:
- Crime/safety (including fare evasion and passenger safety)
- More reliable/efficient/on time service/less bunching of busses
- Better communication and public outreach
- Improved cleanliness of transit stops
- Additional funding to create faster, safer and more reliable public transportation
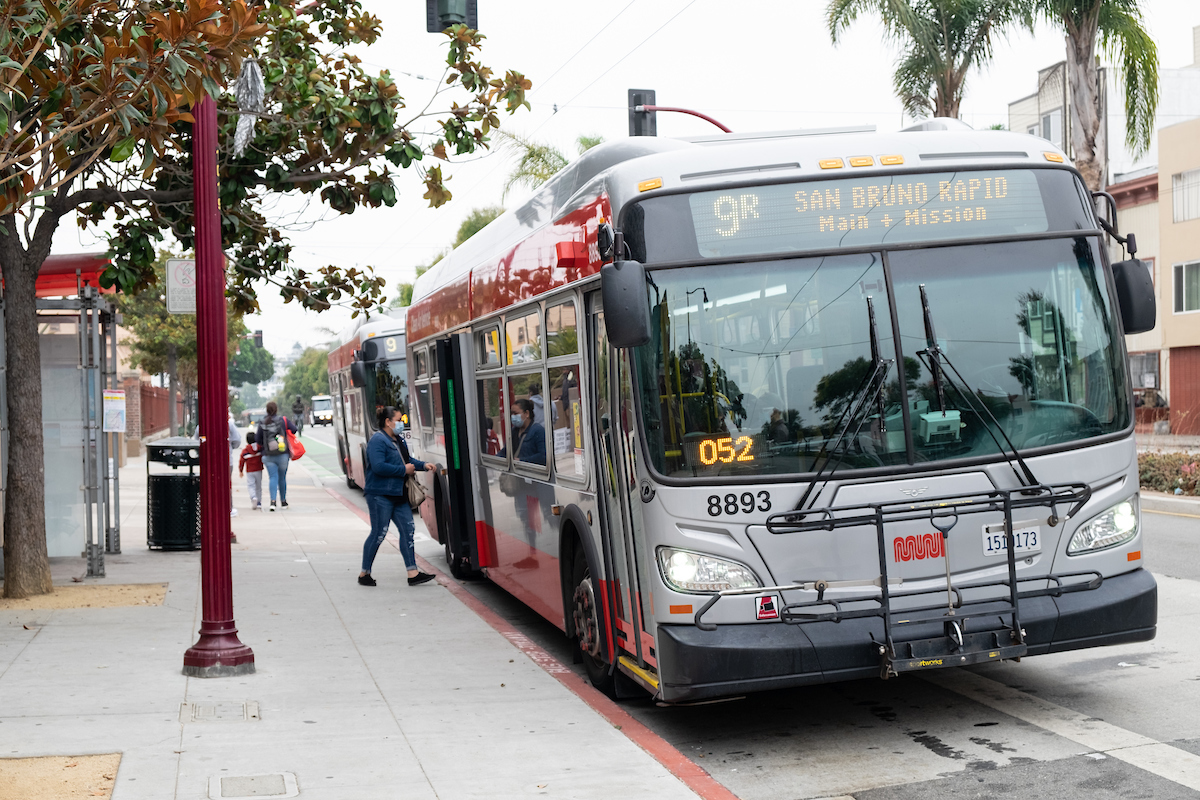
Safety is a Key Priority
- Over 50% of respondents cited “Increasing safety from crime on Muni buses” as an extremely urgent priority.
- Respondents answering the Community survey in Chinese had the strongest concern about safety. 58% of Chinese speakers consider Muni unsafe from crime, almost a full 20% higher than respondents to the survey in English.
- The safety of our customers and staff is a top priority for the SFMTA. We have increased the number of staff riding Muni as a visual deterrent to crime.
- We will continue our efforts to make sure all Muni riders are safe and can be confident riding our buses and trains and will update you with our progress.
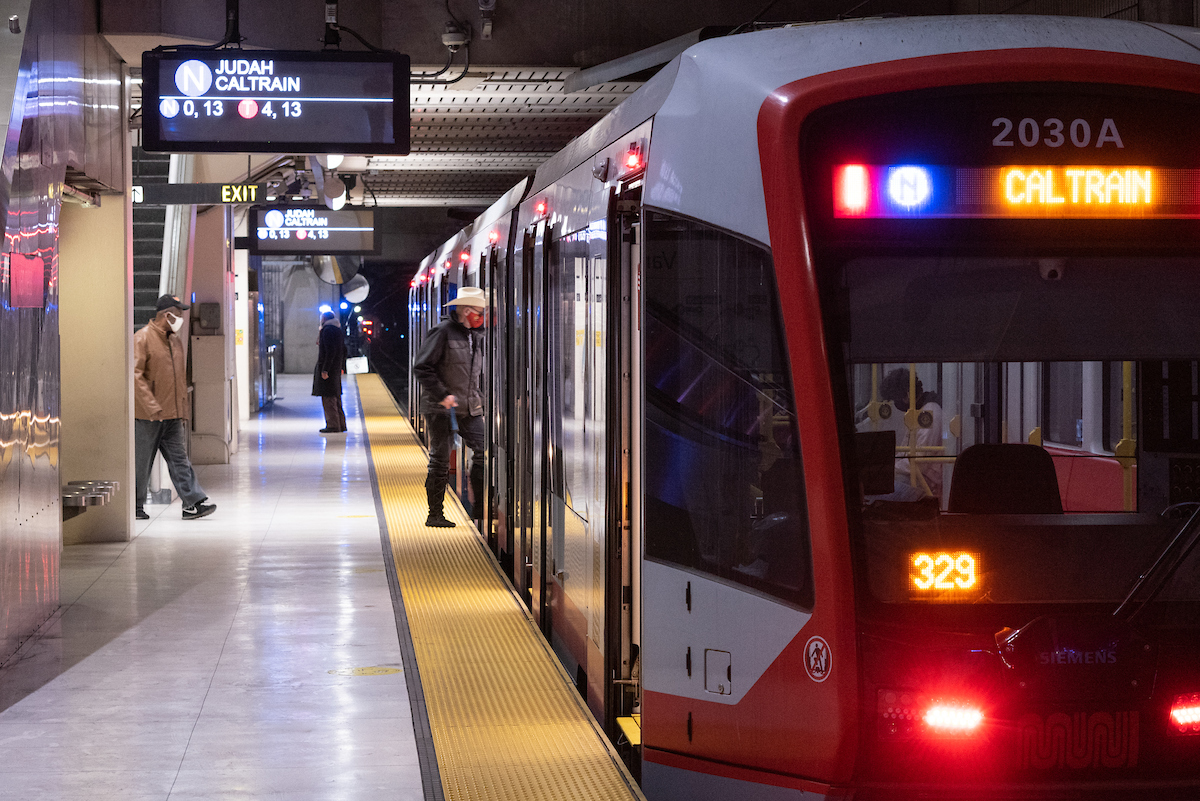
Increasing Reliability through Repairing and Upgrading our System
- A top priority of respondents is “Repairing and maintaining Muni equipment and facilities to ensure vehicles’ safety, frequency and reliability,” and our commitment to timely repair and maintenance work is in line with that.
- Improving Real-Time Communications
- Riders would like more reliable real-time communications to help with trip planning.
- Improvements to the customer experience can be seen through the ongoing implementation of our new Next Generation Customer Information System.
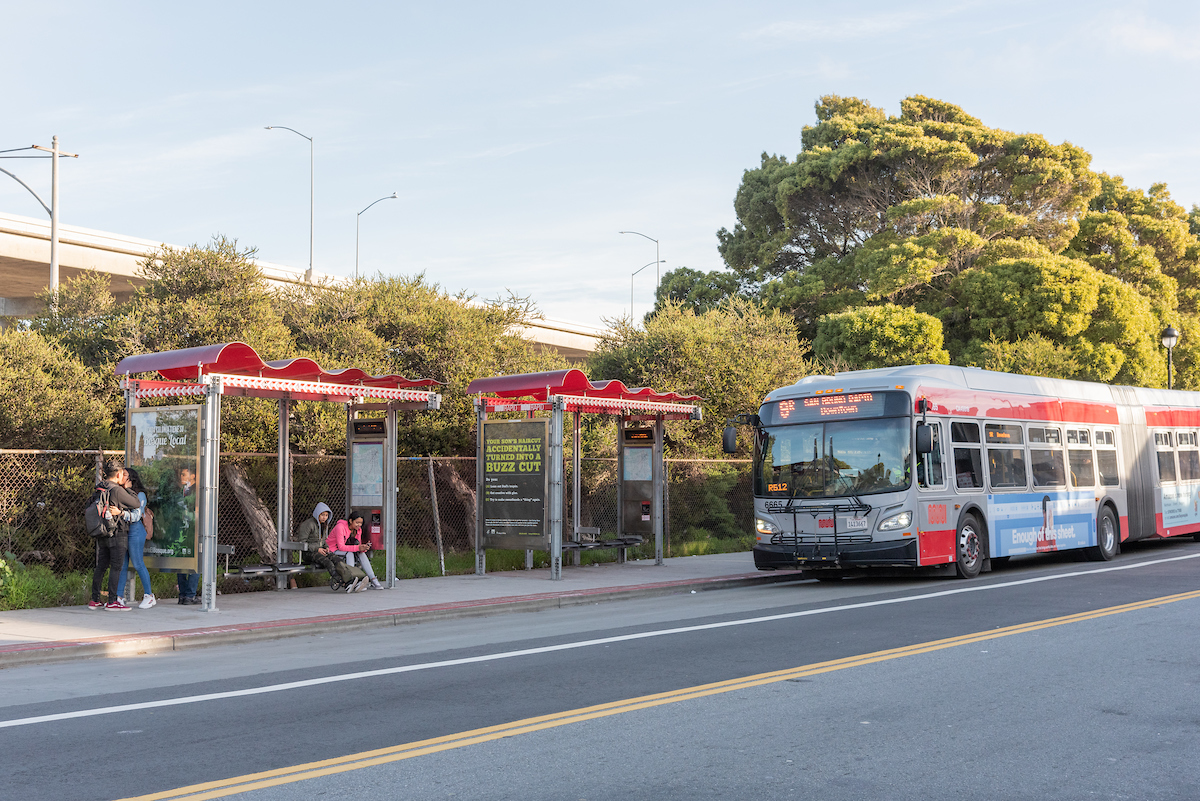
Respondents Understand the Need for Additional Public Transportation Funding
- Finally, a key takeaway from the Community Survey is that respondents want a better and more reliable public transportation system and recognize the need for additional funding to accomplish our shared vision and goals.
- Respondents support investing in Muni service as well as expanding safe bike and pedestrian pathways to ensure everyone in the city can access jobs and get where they need to go easily, regardless of their income or neighborhood.
We agree that an affordable, reliable and safe public transit system is a critical part of a thriving and equitable community. We are committed to working toward this goal and thank our frontline staff for working so hard to improve service.
Published May 05, 2023 at 02:11AM
https://ift.tt/KGOcwmN
Nhận xét
Đăng nhận xét